Management Discussion
This document synthesis is waiting to be generated.
Management Discussion
Item 7. MANAGEMENT’S DISCUSSION AND ANALYSIS OF FINANCIAL CONDITION AND RESULTS OF OPERATIONS
The following discussion and analysis provides information that management believes is relevant to an assessment and understanding of our consolidated results of operations and financial condition. You should read this discussion and analysis in conjunction with the consolidated financial statements and notes thereto included elsewhere in this Annual Report on Form 10-K. Certain amounts may not foot or tie to other disclosures due to rounding. Certain information in this discussion and analysis or set forth elsewhere in this Annual Report on Form 10-K contains forward-looking statements that involve numerous risks and uncertainties, including, but not limited to, those described under the sections entitled “Cautionary Note Regarding Forward-Looking Statements” and Part I, Item 1A. “Risk Factors”. We assume no obligation to update any of these forward-looking statements. Actual results may differ materially from those contained in any forward-looking statements.
Business OverviewWe are a member-centric, one-stop shop for financial services that allows members to borrow, save, spend, invest and protect their money. We refer to our customers as “members”, as defined under “Key Business Metrics”. Our mission is to help our members achieve financial independence in order to realize their ambitions. We were founded in 2011 and have developed a suite of financial products that offers the speed, selection, content and convenience that only an integrated digital platform can provide. Everything we do today is geared toward helping our members “Get Your Money Right” and we strive to innovate and build ways for our members to achieve this goal.
In order to help achieve our mission, we offer personal loans, student loans, home loans and related servicing, as well as senior secured loans. We also offer a variety of financial services products, such as SoFi Money checking and savings, SoFi Credit Card, SoFi Invest, and SoFi Relay, that provide more daily interactions with our members, and we offer products and capabilities, such as SoFi At Work, that are designed to appeal to enterprises. We continued to expand our platform capabilities for enterprises through: (i) our acquisition of Galileo in 2020, which provides technology platform services to financial and non-financial institutions and which has allowed us to vertically integrate across more of our financial services, and (ii) the Technisys Merger in the first quarter of 2022, through which we expanded our technology platform services to include a cloud-native, customizable, extensible core technology as well as access to a broader international market. We believe that these expansions will deepen our participation in the entire technology ecosystem powering digital financial services.
See Item 1. “Business—Our Reportable Segments” for a discussion of our segments and their corresponding products. The discussion below focuses on the ways in which our key products and services within each reportable segment generate revenues and/or incur expenses for the Company.
Business Highlights
We achieved strong results for our company for the year ended December 31, 2023, including record total net revenue of $2.1 billion, representing an increase of 35% over total net revenue in 2022. Record revenue at the company level was driven by record net revenue across all three of our business segments. We realized strong momentum in member and product growth and cross-buy adds, reflecting the benefits of our broad product suite and Financial Services Productivity Loop strategy. We added approximately 2.3 million new members during 2023, with over 7.5 million total members as of December 31, 2023, a 44% year over year increase. We also added approximately 3.2 million new products, with over 11.1 million total products as of December 31, 2023, a 41% year over year increase.
Lending segment contribution profit of $823.3 million for the year ended December 31, 2023, at a margin of 60%, increased 24% over 2022, which had a contribution margin of 58%. Total net revenue of $1.4 billion for the year ended December 31, 2023 increased 20% over 2022. Additionally, average net interest margin of 5.88% in 2023 increased 48 basis points compared to 5.40% in 2022. Growth in net interest income was driven by an increase in both average interest-earning assets and average yields, partially offset by an increase in the cost of interest-bearing liabilities. Origination volume increased 34% year over year, primarily driven by demand for personal loans and despite continued macroeconomic headwinds in the student and home loan businesses. Student loans saw some increasing demand in the third quarter of 2023 ahead of the resumption of principal and interest payments on federally-held student loans, and we expect that we may continue to see modest growth in student loan refinancing. Our acquisition of Wyndham in the second quarter of 2023 provided increased capacity and capabilities for our home loans product, which contributed to a notable year over year increase in home loans, and which we expect to continue to provide benefits, while we expect overall home loans growth could be correlated with rate movements in 2024.
SoFi Technologies, Inc.
TABLE OF CONTENTS
Technology Platform segment contribution profit of $94.8 million for the year ended December 31, 2023 increased 24% over 2022, and total net revenue of $352.3 million for the year ended December 31, 2023 increased 12% over 2022. Growth was driven by continued strong organic growth of existing partners and new product adoption, as well as notable contributions from increasingly diversified clients which have launched within the second half of 2023. Margin improvements were driven primarily by Galileo account growth and decreases in directly attributable expenses, as we begin to realize the benefits of earlier investments made to support Technology Platform product development and the integration of Galileo and Technisys. The year over year comparison was also impacted by a partial period of contribution from Technisys in 2022 compared to a full period of contribution in 2023. We continue to make significant strides in our strategy of leveraging our unique product suite to pursue diversified growth and expansion via new products and geographies, in addition to larger, more durable revenue opportunities. We expect growth in segment revenue to continue to accelerate in 2024, as we are well positioned to capture opportunities from traditional financial institutions and nonfinancial categories.
Within Financial Services, contribution loss of $0.3 million for the year ended December 31, 2023 significantly improved compared to a contribution loss of $199.4 million in 2022, and reflected positive contribution profit during the third and fourth quarters of 2023. Total net revenue of $436.5 million for the year ended December 31, 2023 increased 160% over 2022. We achieved continued strong growth in deposits, ending the year with $18.6 billion of deposits as of December 31, 2023, allowing us to maintain diversified sources of funding and driving an increase in net interest income earned on our deposits. In addition, we grew total Financial Services products by 45% year over year. We continue to realize scale in our marketing spend and improvement in operating leverage in the segment. We expect to continue to scale our products through increased brand awareness and network effects, and continue to improve contribution profit in the segment.
The strength of our results underscores our belief that our suite of differentiated products and services provides the foundation for a diversified business that can endure through market cycles as well as exogenous factors. For instance, our access to multiple channels of funding, including deposit and loan warehouse funding, provides an advantage via increased optionality in sourcing liquidity through different environments and periods of capital markets volatility, as well as increases our flexibility to capture additional net interest margin and optimize returns, which typically provides more stable earnings in any macroeconomic environment but is particularly important during times of excess macroeconomic volatility.
During 2023, we continued to have strong deposit contribution from direct deposit members with a high quality median FICO score. We expect that our funding mix will continue to move towards deposit funding, which has a lower borrowing cost of funds than our warehouse and securitization financing model. We also provided our members with access to expanded FDIC insurance coverage through a network of participating banks in our Insured Deposit Program, further enhancing our benefits offering to our members. Our total capital ratio, as calculated under applicable regulatory capital rules, was 15.3% as of December 31, 2023. See Note 21. Regulatory Capital to the Notes to Consolidated Financial Statements for additional information.
Lending Segment
Net interest income, which we define as the difference between the earned interest income and interest expense to finance loans, is a key component of the profitability of our Lending segment. We implemented an FTP framework to attribute net interest income to our business segments based on their usage and/or provision of funding, under which Lending segment net interest income represents the difference between interest income earned on our loans and an FTP charge for the segment’s use of funds to originate loans, which can fluctuate based on changes in interest rates, funding curves, the composition of our balance sheet and the availability of capital. See Note 20. Business Segment and Geographic Information to the Notes to Consolidated Financial Statements for additional information on the FTP framework.
Technology Platform Segment
We earn technology products and solutions fees for providing an integrated platform as a service for financial and non-financial institutions. Many of our Technology Platform segment contracts are multi-year contracts. In certain of our contracts, we provide for a variety of integrated platform services, which vary by client and are either non-cancellable or cancellable with a substantive payment. Pricing structures under these contracts are typically volume-based, or a combination of activity and volume-based, and payment terms are predominantly monthly in arrears. Many of these contracts contain minimum monthly payments, which may result in credits if we do not meet the agreed upon monthly service levels. We also earn subscription and service fees for providing software licenses and associated services, including implementation, maintenance and subsequent development work. We charge a recurring subscription fee for the software license and related maintenance services. Other software-related services are billed on a periodic basis as the services are provided. Certain arrangements for software and related services contain a provision for a fixed upfront payment.
SoFi Technologies, Inc.
TABLE OF CONTENTS
Financial Services Segment
We earn revenues in connection with our Financial Services segment primarily in the following ways:
•Net interest income: Net interest income is a key component of the profitability of our Financial Services segment as it relates primarily to our SoFi Money and credit card products. Net interest income on SoFi Money is based on interest income determined using our FTP framework, net of interest expense based on the interest rate offered to our members on their deposits. Net interest income on credit card is based on the contractual interest included in credit card agreements, net of interest expense as determined using the FTP framework. See Note 20. Business Segment and Geographic Information to the Notes to Consolidated Financial Statements for additional information on the FTP framework.
•Referral fees: Through strategic partnerships, we earn a specified referral fee in connection with referral activity we facilitate through our platform. Referral fees are paid to us by third-party partners that offer services to end users who do not use one of our product offerings, but who were referred to the partners through our platform. We also earn referral fulfillment fees for providing pre-qualified borrower referrals to a third-party partner who separately contracts with a loan originator. Our referral fee is calculated as either a fixed price per successful referral or a percentage of the transaction volume between the enterprise partners and referred consumers.
•Interchange fees: We earn interchange fees from our SoFi-branded debit cards and credit cards. These fees are remitted by merchants and represent a percentage of the underlying transaction value processed through a payment network. We engage a card association and enter into contracts that establish the shared economics of SoFi-branded transaction cards.
•Brokerage fees: We earn brokerage fees primarily from our share lending and payment for order flow arrangements related to our SoFi Invest product, in which we benefit through a negotiated multi-year revenue sharing arrangement, since our members' brokerage activity drives the share lending and payment for order flow volume.
Non-GAAP Financial MeasuresOur management and Board of Directors use adjusted net revenue and adjusted EBITDA, which are non-GAAP financial measures, to evaluate our operating performance, formulate business plans, help better assess our overall liquidity position and make strategic decisions, including those relating to operating expenses and the allocation of internal resources. Accordingly, we believe that these non-GAAP measures provide useful information to investors and others in understanding and evaluating our operating results in the same manner as our management and Board of Directors.
Adjusted Net Revenue
Adjusted net revenue is defined as total net revenue, adjusted to exclude the fair value changes in servicing rights and residual interests classified as debt due to valuation inputs and assumptions changes, which relate only to our Lending segment, as well as gains and losses on extinguishment of debt. We adjust total net revenue to exclude these items, as they are non-cash charges that are not realized during the period, and therefore positive or negative changes do not impact the cash available to fund our operations. This measure helps provide our management with an understanding of the net revenue available to finance our operations and helps management better decide on the proper expenses to authorize for each of our operating segments, to ultimately help achieve target contribution profit margins. Therefore, the measure of adjusted net revenue serves as both the starting point for how we think about the liquidity generated from our operations and also the starting point for our annual financial planning, the latter of which focuses on the cash we expect to generate from our operating segments to help fund the current year’s strategic objectives. Adjusted net revenue has limitations as an analytical tool and should not be considered in isolation from, or as a substitute for, the analysis of other GAAP financial measures, such as total net revenue. The primary limitation of adjusted net revenue is its lack of comparability to other companies that do not utilize this measure or that use a similar measure that is defined in a different manner.
SoFi Technologies, Inc.
TABLE OF CONTENTS
Total Net Revenue and Adjusted Net Revenue
In Thousands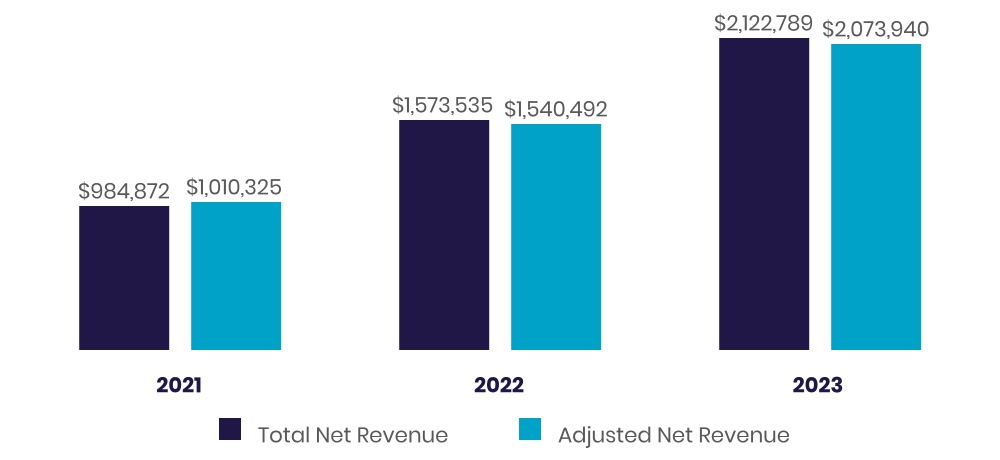
The following table reconciles adjusted net revenue to total net revenue, the most directly comparable GAAP measure:
Year Ended December 31,
($ in thousands) 2023 2022 2021
Total net revenue $2,122,789 $1,573,535 $984,872
Servicing rights – change in valuation inputs or assumptions(1) (34,700) (39,651) 2,651
Residual interests classified as debt – change in valuation inputs or assumptions(2) 425 6,608 22,802
Gain on extinguishment of debt(3) (14,574) — —
Adjusted net revenue $2,073,940 $1,540,492 $1,010,325
(1)Reflects changes in fair value inputs and assumptions on servicing rights, including conditional prepayment, default rates and discount rates. These assumptions are highly sensitive to market interest rate changes and are not indicative of our performance or results of operations. Moreover, these non-cash charges are unrealized during the period and, therefore, have no impact on our cash flows from operations. As such, these positive and negative changes are adjusted out of total net revenue to provide management and financial users with better visibility into the net revenue available to finance our operations and our overall performance.
(2)Reflects changes in fair value inputs and assumptions on residual interests classified as debt, including conditional prepayment, default rates and discount rates. When third parties finance our consolidated securitization VIEs by purchasing residual interests, we receive proceeds at the time of the closing of the securitization and, thereafter, pass along contractual cash flows to the residual interest owner. These residual debt obligations are measured at fair value on a recurring basis, but they have no impact on our initial financing proceeds, our future obligations to the residual interest owner (because future residual interest claims are limited to contractual securitization collateral cash flows), or the general operations of our business. As such, these positive and negative non-cash changes in fair value attributable to assumption changes are adjusted out of total net revenue to provide management and financial users with better visibility into the net revenue available to finance our operations.
(3)Reflects gain on extinguishment of debt. Gains and losses are recognized during the period of extinguishment for the difference between the net carrying amount of debt extinguished and the fair value of equity securities issued. These non-cash charges are not indicative of our core operating performance, and as such are adjusted out of total net revenue to provide management and financial users with better visibility into the net revenue available to finance our operations and our overall performance.
The following table reconciles adjusted net revenue to total net revenue, the most directly comparable GAAP measure, for the quarterly periods presented:
Quarter Ended
($ in thousands) December 31, 2023 September 30, 2023 June 30, 2023 March 31, 2023 December 31, 2022 September 30, 2022 June 30, 2022 March 31, 2022
Total net revenue $615,404 $537,209 $498,018 $472,158 $456,679 $423,985 $362,527 $330,344
Servicing rights – change in valuation inputs or assumptions(1) (6,595) (7,420) (8,601) (12,084) (12,791) (6,182) (9,098) (11,580)
Residual interests classified as debt – change in valuation inputs or assumptions(2) 10 928 (602) 89 (470) 1,453 2,662 2,963
Gain on extinguishment of debt(3) (14,574) — — — — — — —
Adjusted net revenue $594,245 $530,717 $488,815 $460,163 $443,418 $419,256 $356,091 $321,727
SoFi Technologies, Inc.
TABLE OF CONTENTS
(1)See footnote (1) to the table above.
(2)See footnote (2) to the table above.
(3)See footnote (3) to the table above.
The following table reconciles adjusted net revenue for the Lending segment to total net revenue, the most directly comparable GAAP measure for the Lending segment:
Year Ended December 31,
($ in thousands) 2023 2022 2021
Total net revenue – Lending $1,370,621 $1,139,991 $738,323
Servicing rights – change in valuation inputs or assumptions(1) (34,700) (39,651) 2,651
Residual interests classified as debt – change in valuation inputs or assumptions(2) 425 6,608 22,802
Adjusted net revenue – Lending $1,336,346 $1,106,948 $763,776
(1)See footnote (1) to the table above.
(2)See footnote (2) to the table above.
Adjusted EBITDA
Adjusted EBITDA is defined as net income (loss), adjusted to exclude, as applicable: (i) corporate borrowing-based interest expense (our adjusted EBITDA measure is not adjusted for warehouse or securitization-based interest expense, nor deposit interest expense and finance lease liability interest expense, as these are direct operating expenses), (ii) income tax expense (benefit), (iii) depreciation and amortization, (iv) share-based expense (inclusive of equity-based payments to non-employees), (v) restructuring charges (vi) impairment expense (inclusive of goodwill impairment and property, equipment and software abandonments), (vii) transaction-related expenses, (viii) foreign currency impacts related to operations in highly inflationary countries, (ix) fair value changes in warrant liabilities, (x) fair value changes in each of servicing rights and residual interests classified as debt due to valuation assumptions, (xi) gain on extinguishment of debt, and (xii) other charges, as appropriate, that are not expected to recur and are not indicative of our core operating performance. We believe adjusted EBITDA provides a useful measure to investors for period-over-period comparisons of our business, as it removes the effects of certain non-cash items and certain charges that are not indicative of our core operating performance or results of operations. It is also a measure that management relies upon to evaluate cash flows generated from operations, and therefore the extent of additional capital, if any, required to invest in strategic initiatives. Adjusted EBITDA has limitations as an analytical tool and should not be considered in isolation from, or as a substitute for, the analysis of other GAAP financial measures, such as net income (loss). Some of the limitations of adjusted EBITDA include that it does not reflect the impact of working capital requirements or capital expenditures and it is not a universally consistent calculation among companies in our industry, which limits its usefulness as a comparative measure.
Net Loss and Adjusted EBITDA
In Thousands
SoFi Technologies, Inc.
TABLE OF CONTENTS
The following table reconciles adjusted EBITDA to net loss, the most directly comparable GAAP measure:
Year Ended December 31,
($ in thousands) 2023 2022 2021
Net loss $(300,742) $(320,407) $(483,937)
Non-GAAP adjustments:
Interest expense – corporate borrowings(1) 36,833 18,438 10,345
Income tax (benefit) expense(2) (416) 1,686 2,760
Depreciation and amortization(3) 201,416 151,360 101,568
Share-based expense 271,216 305,994 239,371
Restructuring charges(4) 12,749 — —
Impairment expense(5) 248,417 — —
Foreign currency impact of highly inflationary subsidiaries(6) 10,971 — —
Transaction-related expense(7) 142 19,318 27,333
Fair value changes in warrant liabilities(8) — — 107,328
Servicing rights – change in valuation inputs or assumptions(9) (34,700) (39,651) 2,651
Residual interests classified as debt – change in valuation inputs or assumptions(10) 425 6,608 22,802
Gain on extinguishment of debt(11) (14,574) — —
Total adjustments 732,479 463,753 514,158
Adjusted EBITDA $431,737 $143,346 $30,221
(1)Our adjusted EBITDA measure adjusts for corporate borrowing-based interest expense, as these expenses are a function of our capital structure. Corporate borrowing-based interest expense includes interest on our revolving credit facility and the amortization of debt discount and debt issuance costs on our convertible notes, and for 2021, interest on the seller note issued in connection with our acquisition of Galileo. Revolving credit facility interest expense in 2023 and 2022 increased due to higher interest rates relative to the prior years on identical outstanding debt.
(2)Income taxes in 2023 were primarily attributable to income tax benefits from foreign losses in jurisdictions with net deferred tax liabilities related to Technisys, offset by income tax expense associated with the profitability of SoFi Bank in state jurisdictions where separate filings are required, as well as federal taxes where our tax credits and loss carryforwards may be limited. Income taxes in 2022 were primarily attributable to tax expense at SoFi Lending Corp and SoFi Bank due to profitability in state jurisdictions where separate filings are required and recognition of expense from Technisys in certain Latin American countries where separate returns are filed. The expense was partially offset by deferred tax benefits from the amortization of intangible assets acquired in the Technisys Merger. Income taxes in 2021 were primarily attributable to the profitability of SoFi Lending Corp. profitability in state jurisdictions where separate filings are required. See Note 17. Income Taxes to the Notes to Consolidated Financial Statements for additional information.
(3)Depreciation and amortization expense in 2023 increased compared to 2022 primarily in connection with acquisitions and growth in our internally-developed software balance. The increase in 2022 compared to 2021 was primarily in connection with acquisitions and growth in our software balance, partially offset by the acceleration of core banking infrastructure amortization during the 2021 period.
(4)Restructuring charges in 2023 primarily included employee-related wages, benefits and severance associated with a small reduction in headcount in our Technology Platform segment in the first quarter of 2023 and expenses in the fourth quarter of 2023 related to a reduction in headcount across the Company, which do not reflect expected future operating expenses and are not indicative of our core operating performance.
(5)Impairment expense in 2023 includes $247,174 related to goodwill impairment, and $1,243 related to a sublease arrangement, which are not indicative of our core operating performance.
(6)Foreign currency charges reflect the impacts of highly inflationary accounting for our operations in Argentina, which are related to our Technology Platform segment and commenced in the first quarter of 2022 with the Technisys Merger. For the year ended December 31, 2023, all amounts were reflected in the fourth quarter, as inter-quarter amounts were determined to be immaterial. Amounts in 2022 were determined to be immaterial.
(7)Transaction-related expenses in 2023 and 2022 primarily included financial advisory and professional services costs associated with our acquisitions of Wyndham and Technisys, respectively. Transaction-related expenses in 2021 included the special payment to the holders of Series 1 Redeemable Preferred Stock in conjunction with the Business Combination and financial advisory and professional costs associated with our then-pending acquisitions of Golden Pacific and Technisys.
(8)Our adjusted EBITDA measure excludes the non-cash fair value changes in warrants accounted for as liabilities, which were measured at fair value through earnings. The amount in 2021 related to changes in the fair value of Series H warrants issued by Social Finance in connection with certain redeemable preferred stock issuances. We did not measure the Series H warrants at fair value subsequent to May 28, 2021 in conjunction with the Business Combination, as they were reclassified into permanent equity. In addition, in conjunction with the Business Combination, SoFi Technologies assumed certain common stock warrants (“SoFi Technologies warrants”) that were accounted for as liabilities and measured at fair value on a recurring basis. The fair value of the SoFi Technologies warrants was based on the closing price of ticker SOFIW and, therefore, fluctuated based on market activity. The outstanding SoFi Technologies warrants were either exercised during the fourth quarter of 2021 or redeemed on December 6, 2021.
(9)Reflects changes in fair value inputs and assumptions, including market servicing costs, conditional prepayment, default rates and discount rates. This non-cash change is unrealized during the period and, therefore, has no impact on our cash flows from operations. As such, these positive and negative changes in fair value attributable to assumption changes are adjusted out of net loss to provide management and financial users with better visibility into the earnings available to finance our operations.
SoFi Technologies, Inc.
TABLE OF CONTENTS
(10)Reflects changes in fair value inputs and assumptions, including conditional prepayment, default rates and discount rates. When third parties finance our consolidated VIEs through purchasing residual interests, we receive proceeds at the time of the securitization close and, thereafter, pass along contractual cash flows to the residual interest owner. These obligations are measured at fair value on a recurring basis, which has no impact on our initial financing proceeds, our future obligations to the residual interest owner (because future residual interest claims are limited to contractual securitization collateral cash flows), or the general operations of our business. As such, these positive and negative non-cash changes in fair value attributable to assumption changes are adjusted out of net loss to provide management and financial users with better visibility into the earnings available to finance our operations.
(11)Reflects gain on extinguishment of debt. Gains and losses are recognized during the period of extinguishment for the difference between the net carrying amount of debt extinguished and the fair value of equity securities issued. These non-cash charges are not indicative of our core operating performance, and as such are adjusted out of total net revenue to provide management and financial users with better visibility into the net revenue available to finance our operations and our overall performance.
The following table reconciles adjusted EBITDA to net loss, the most directly comparable GAAP measure, for the quarterly periods presented:
Quarter Ended
($ in thousands) December 31, 2023 September 30, 2023 June 30, 2023 March 31, 2023 December 31, 2022 September 30, 2022 June 30, 2022 March 31, 2022
Net loss $47,913 $(266,684) $(47,549) $(34,422) $(40,006) $(74,209) $(95,835) $(110,357)
Non-GAAP adjustments:
Interest expense – corporate borrowings 9,882 9,784 9,167 8,000 7,069 5,270 3,450 2,649
Income tax (benefit) expense 3,245 (244) (1,780) (1,637) 1,057 (242) 119 752
Depreciation and amortization 53,449 52,516 50,130 45,321 42,353 40,253 38,056 30,698
Share-based expense 69,107 62,005 75,878 64,226 70,976 77,855 80,142 77,021
Restructuring charges 7,796 — — 4,953 — — — —
Impairment expense — 247,174 — 1,243 — — — —
Foreign currency impact of highly inflationary subsidiaries 10,971 — — — — — — —
Transaction-related expense — (34) 176 — 1,872 100 808 16,538
Servicing rights – change in valuation inputs or assumptions (6,595) (7,420) (8,601) (12,084) (12,791) (6,182) (9,098) (11,580)
Residual interests classified as debt – change in valuation inputs or assumptions 10 928 (602) 89 (470) 1,453 2,662 2,963
Gain on extinguishment of debt (14,574) — — — — — — —
Total adjustments 133,291 364,709 124,368 110,111 110,066 118,507 116,139 119,041
Adjusted EBITDA $181,204 $98,025 $76,819 $75,689 $70,060 $44,298 $20,304 $8,684
Key Business MetricsThe table below presents the key business metrics that management uses to evaluate our business, measure our performance, identify trends and make strategic decisions:
                                                                                                                    December 31,                                   2023 vs. 2022                                   2022 vs. 2021
                                               2023                        2022                        2021                                  # Change                   % Change             # Change                   % Change
Members 7,541,860 5,222,533 3,460,298 2,319,327 44 % 1,762,235 51 %
Total Products 11,142,476 7,894,636 5,173,197 3,247,840 41 % 2,721,439 53 %
Total Products — Lending segment 1,663,006 1,340,597 1,078,952 322,409 24 % 261,645 24 %
Total Products — Financial Services segment 9,479,470 6,554,039 4,094,245 2,925,431 45 % 2,459,794 60 %
Total Accounts — Technology Platform segment 145,425,391 130,704,351 99,660,657 14,721,040 11 % 31,043,694 31 %
See “Summary Results by Segment” for additional metrics we review at the segment level.
Members
We refer to our customers as “members”. We define a member as someone who has a lending relationship with us through origination and/or ongoing servicing, opened a financial services account, linked an external account to our platform or signed up for our credit score monitoring service. Our members have continuous access to our CFPs, our career advice services, our member events, our content, educational material, news, and our tools and calculators, which are provided at no cost to the member. Additionally, our mobile app and website have a member home feed that is personalized and delivers content to a
SoFi Technologies, Inc.
TABLE OF CONTENTS
member about what they must do that day in their financial life, what they should consider doing that day in their financial life, and what they can do that day in their financial life.
Once someone becomes a member, they are always considered a member unless they violate our terms of service. We adjust our total number of members in the event a member is removed in accordance with our terms of service. This could occur for a variety of reasons—including fraud or pursuant to certain legal processes—and, as our terms of service evolve together with our business practices, product offerings and applicable regulations, our grounds for removing members from our total member count could change. The determination that a member should be removed in accordance with our terms of service is subject to an evaluation process, following the completion, and based on the results, of which, relevant members and their associated products are removed from our total member count in the period in which such evaluation process concludes. However, depending on the length of the evaluation process, that removal may not take place in the same period in which the member was added to our member count or the same period in which the circumstances leading to their removal occurred. For this reason, our total member count may not yet reflect adjustments that may be made once ongoing evaluation processes, if any, conclude.
We view members as an indication not only of the size and a measurement of growth of our business, but also as a measure of the significant value of the data we have collected over time. The data we collect from our members helps us to, among other things: (i) assess loan life performance data on each loan in our ecosystem, which can inform risk-based interest rates that we can offer our members, (ii) understand our members’ spending behavior to identify and suggest other products we offer that may align with the members’ financial needs, and (iii) enhance our opportunities to sell additional products to our members, as our members represent a vital source of marketing opportunities. When we provide additional products to members, it helps improve our unit economics per member, as we save on marketing costs that we would otherwise incur to attract new members. It also increases the lifetime value of an individual member. This in turn enhances our Financial Services Productivity Loop. Member growth is generally an indicator of future revenue, but is not directly correlated with revenues, since not all members who sign up for one of our products fully utilize or continue to use our products, and not all of our products (such as our complimentary product, SoFi Relay) provide direct sources of revenue.
Since our inception through December 31, 2023, we have served approximately 7.5 million members who have used approximately 11.1 million products on the SoFi platform.
Members
In Thousands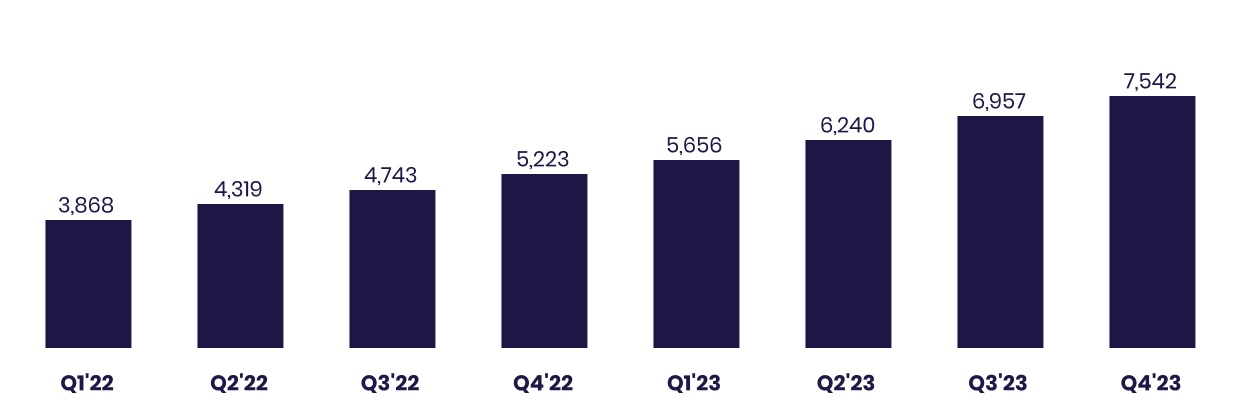
Total Products
Total products refers to the aggregate number of lending and financial services products that our members have selected on our platform since our inception through the reporting date, whether or not the members are still registered for such products. Total products is a primary indicator of the size and reach of our Lending and Financial Services segments. Management relies on total products metrics to understand the effectiveness of our member acquisition efforts and to gauge the propensity for members to use more than one product.
In our Lending segment, total products refers to the number of personal loans, student loans and home loans that have been originated through our platform through the reporting date, whether or not such loans have been paid off. If a member has multiple loan products of the same loan product type, such as two personal loans, that is counted as a single product. However,
SoFi Technologies, Inc.
TABLE OF CONTENTS
if a member has multiple loan products across loan product types, such as one personal loan and one home loan, that is counted as two products.
In our Financial Services segment, total products refers to the number of SoFi Money accounts (inclusive of checking and savings accounts held at SoFi Bank and cash management accounts), SoFi Invest accounts, SoFi Credit Card accounts (including accounts with a zero dollar balance at the reporting date), referred loans (which are originated by a third-party partner to which we provide pre-qualified borrower referrals), SoFi At Work accounts and SoFi Relay accounts (with either credit score monitoring enabled or external linked accounts) that have been opened through our platform through the reporting date. Checking and savings accounts are considered one account within our total products metric. Our SoFi Invest service is composed of three products: active investing accounts, robo-advisory accounts and digital assets accounts. Our members can select any one or combination of the types of SoFi Invest products. See Note 1. Organization, Summary of Significant Accounting Policies and New Accounting Standards for additional information on the transfer of the crypto services. If a member has multiple SoFi Invest products of the same account type, such as two active investing accounts, that is counted as a single product. However, if a member has multiple SoFi Invest products across account types, such as one active investing account and one robo-advisory account, those separate account types are considered separate products. In the event a member is removed in accordance with our terms of service, as discussed under “Members” above, the member’s associated products are also removed.
Products
In Thousands
Total lending products were composed of the following:
December 31, 2023 vs. 2022 2022 vs. 2021
Lending Products 2023 2022 2021 Variance % Change Variance % Change
Personal loans 1,113,864 837,462 610,348 276,402 33 % 227,114 37 %
Student loans 519,489 477,132 445,569 42,357 9 % 31,563 7 %
Home loans 29,653 26,003 23,035 3,650 14 % 2,968 13 %
Total lending products 1,663,006 1,340,597 1,078,952 322,409 24 % 261,645 24 %
Total financial services products were composed of the following:
December 31, 2023 vs. 2022 2022 vs. 2021
Financial Services Products 2023 2022 2021 Variance % Change Variance % Change
Money(1) 3,374,310 2,195,402 1,436,955 1,178,908 54 % 758,447 53 %
Invest 2,380,641 2,158,864 1,595,143 221,777 10 % 563,721 35 %
Credit Card 245,385 171,425 91,216 73,960 43 % 80,209 88 %
Referred loans(2) 55,231 40,980 7,659 14,251 35 % 33,321 435 %
Relay 3,336,868 1,921,986 930,181 1,414,882 74 % 991,805 107 %
At Work 87,035 65,382 33,091 21,653 33 % 32,291 98 %
Total financial services products 9,479,470 6,554,039 4,094,245 2,925,431 45 % 2,459,794 60 %
SoFi Technologies, Inc.
TABLE OF CONTENTS
(1) Includes checking and savings accounts held at SoFi Bank, and cash management accounts.
(2) Limited to loans wherein we provide third party fulfillment services.
Technology Platform Total Accounts
In our Technology Platform segment, total accounts refers to the number of open accounts at Galileo as of the reporting date. We include intercompany accounts on the Galileo platform as a service in our total accounts metric to better align with the Technology Platform segment revenue reported in Note 20. Business Segment and Geographic Information to the Notes to Consolidated Financial Statements, which includes intercompany revenue. Intercompany revenue is eliminated in consolidation. Total accounts is a primary indicator of the accounts dependent upon our technology platform to use virtual card products, virtual wallets, make peer-to-peer and bank-to-bank transfers, receive early paychecks, separate savings from spending balances, make debit transactions and rely upon real-time authorizations, all of which result in revenues for the Technology Platform segment. We do not measure total accounts for the Technisys products and solutions, as the revenue model is not primarily dependent upon being a fully integrated, stand-ready service.
Technology Platform Accounts(1)(2)
In Millions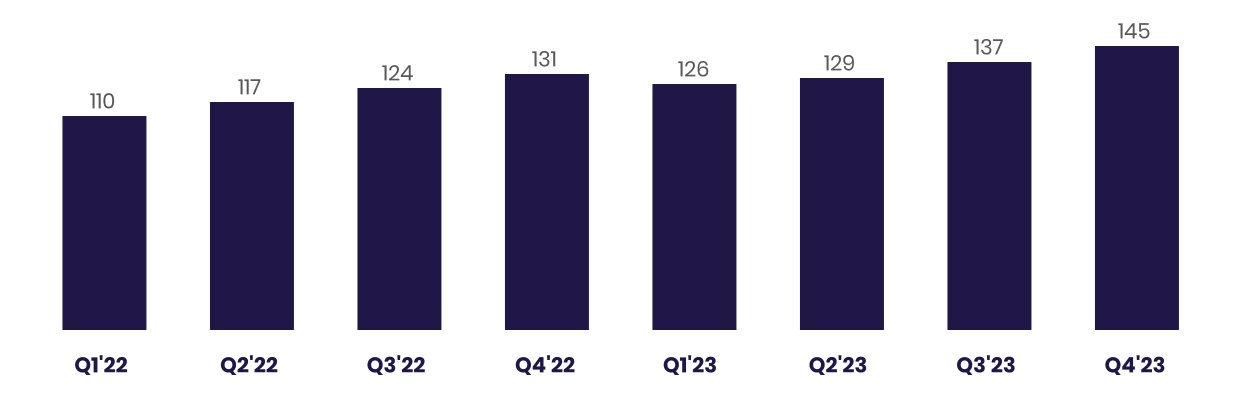
(1)We include SoFi accounts on the Galileo platform as a service in Technology Platform total accounts to better align with the presentation of Technology Platform segment total net revenue.
(2)In 2023, Technology Platform total accounts reflects the previously disclosed migration by one of our clients of the majority of its processing volumes to a pure processor. These accounts remained open for administrative purposes through the end of 2022, and were included in our total accounts in such period.
                                                                                      December 31,                 2023 vs. 2022                 2022 vs. 2021
                 2023                        2022                        2021                                           % Change                      % Change
Total accounts 145,425,391 130,704,351 99,660,657 11 % 31 %
Key Factors Affecting Operating ResultsOur future operating results and cash flows are dependent upon a number of opportunities, challenges and other factors, including our loan origination volume, financial services products and member activity on our platform, growth in technology platform clients, competition and industry trends, general economic conditions and our ability to optimize our national bank charter.
Origination Volume
Our Lending segment is our largest segment, comprising 65%, 72% and 75% of total net revenue during the years ended December 31, 2023, 2022 and 2021, respectively. We are dependent upon the addition of new members and new activity from existing members within our Lending segment to generate origination volume, which we believe is a contributor to Lending segment net revenue. We believe we have a high-quality loan portfolio, as indicated by our Lending segment weighted average origination FICO score of 749 during the year ended December 31, 2023. See “Industry Trends and General Economic Conditions” for the impact of specific economic factors on origination volume.
SoFi Technologies, Inc.
TABLE OF CONTENTS
Member Growth and Activity
We have invested heavily in our platform and are dependent on continued member growth, as well as our ability to generate additional revenues from our existing members using additional products and services. Member growth and activity is critical to our ability to increase our scale and earn a return on our technology and product investments. Growth in members and member activity will depend heavily on our ability to continue to offer attractive products and services at sustainable costs and our continued member acquisition and marketing efforts.
Product Growth
Our aim is to develop and offer a best-in-class integrated financial services platform with products that meet the broad objectives of our members and the lifecycle of their financial needs. We have invested, and continue to invest, heavily in the development, improvement and marketing of our suite of lending and financial services products and are dependent on continued growth in the number of products selected by our members, as well as our ability to build trust and reliability between our members and our platform to reinforce the effects of the Financial Services Productivity Loop. In order to deliver on our strategy, we aim to foster positive member experiences designed to lead to more product adoption by existing members, leading to enhanced profitability for each additional product by lowering overall member acquisition costs.
Galileo Account Growth
Galileo primarily provides technology platform services to financial and non-financial institutions, which enabled us to diversify our business from a primarily consumer-based business to also serve enterprises that rely upon Galileo’s integrated platform as a service to serve their clients. We are dependent on growth in the number of accounts at Galileo, which is an indication of the amount of users that are dependent upon the technology platform for a variety of products and services, including virtual card products, virtual wallets, peer-to-peer and bank-to-bank transfers, early paychecks and relying on real-time authorizations, all of which generate revenue for Galileo.
SoFi Bank
A key element of our long-term strategy has been to secure a national bank charter. In February 2022, we closed the Bank Merger and began operating Golden Pacific Bank as SoFi Bank. In connection with operating a national bank, we have incurred and expect to continue to incur additional costs primarily associated with headcount, technology infrastructure, governance, compliance and risk management, marketing, and other general and administrative expenses.
See Part I, Item 1. “Company Overview—SoFi Bank” for a discussion of the key expected financial benefits to us of operating a national bank. See Part I, Item 1A. “Risk Factors” for discussion of certain potential risks related to being a bank holding company.
Industry Trends and General Economic Conditions
Our results of operations have historically been relatively resilient to economic downturns but in the future may be impacted by the relative strength of the overall economy and its effect on unemployment, asset markets and consumer spending. As general economic conditions improve or deteriorate, the amount of consumer disposable income tends to fluctuate, which in turn impacts consumer spending levels and the willingness of consumers to take out loans to finance purchases or invest in financial assets. Specific economic factors, such as interest rate levels, changes in monetary and related policies, unemployment rates, market volatility, consumer confidence and changing expectations for inflation and deflation, also influence consumer spending, saving, investing and borrowing patterns.
The Federal Reserve increased the benchmark interest rate throughout 2022 and several times in 2023, largely in response to high inflation, low unemployment and strong consumer demand, while balancing macroeconomic risks, such as increased market volatility. We have continued to see strong demand for our deposits as a result of our competitive interest rate offering and access to expanded FDIC insurance coverage through a network of participating banks in our Insured Deposit Program. However, rising interest rates have unfavorably impacted, and could continue to unfavorably impact, demand for refinancing loan products. Economic and market volatility may continue to occur and could worsen, including if there is additional turmoil in the banking and financial services sectors, which could adversely impact our liquidity, results of operations and financial condition. These market developments have negatively impacted customer confidence in the safety and soundness of certain banks. As a result, although we have not observed a decline in our overall deposits to date, our members may choose to maintain deposits with other financial institutions or spread their deposit funds among multiple financial institutions. In addition, if the Federal Reserve does not effectively curb inflation or interest rates further rise unexpectedly or too quickly or macroeconomic conditions deteriorate or do not improve, it could have a negative impact on the overall economy and result in increased unemployment, which could adversely impact our results of operations. In 2023, we saw a continuation
SoFi Technologies, Inc.
TABLE OF CONTENTS
from 2022 of elevated credit spreads across capital markets and changes in consumer credit. Our increased personal loan annualized charge-off rate year over year was reflective of our expectation of credit metrics to revert over time to more normalized levels, but remains healthy, while our higher credit card annualized charge-off rate was reflective of our maturing portfolio. Negative changes to macroeconomic conditions may result in decreased demand for our products, increased operating costs and negatively impact our results of operations.
Fair Value of Loans
We measure our personal loans, student loans and home loans at fair value. During the year ended December 31, 2023, we transferred home loans out of Level 3 and into Level 2 due to an update to pricing sources utilized by third-party valuation specialists, as part of the integration of Wyndham. Other loans do not trade in an active market with readily observable prices and are classified as Level 3.
Our fair value adjustments on loans impact our consolidated results of operations and include adjustments related to loans originated during the period, loans held at the balance sheet date, as well as gains (losses) on loans sold or repurchased during the period. Fair value adjustments made in each reporting period are impacted by factors such as, among others, interest rates, weighted average coupon, credit spreads, actual and estimated losses, prepayment speeds, duration and previous loan sale execution on similar loans. In determining our fair value assumptions, we incorporate recent data impacting the capital markets, as well as factors specific to us. Changes in these factors, either positive or negative, can have a material impact on our results of operations.
The following table summarizes the significant inputs to the fair value model for personal and student loans:
                                                                                    Personal Loans                                                  Student Loans
                                                     December 31,                    September 30,                  December 31,                    September 30,
                                                             2023                             2023                          2023                             2023
Weighted average coupon rate(1) 13.8 % 13.8 % 5.6 % 5.3 %
Weighted average annual default rate 4.8 4.6 0.6 0.5
Weighted average conditional prepayment rate 23.2 20.3 10.5 10.5
Weighted average discount rate 5.5 6.6 4.3 4.8
(1)Represents the average coupon rate on loans held on balance sheet, weighted by unpaid principal balance outstanding at the balance sheet date.
As of the fourth quarter of 2023 relative to the third quarter of 2023, we observed the following trends:
•The weighted average coupon rates on personal loans and student loans increased by 4 bps and 24 bps, respectively, which reflects rate increases passed on to borrowers related to benchmark interest rates increases during the fourth quarter.
•The weighted average discount rates on personal loans and student loans decreased by 103 bps and 57, respectively, as of December 31, 2023 compared to September 30, 2023. For personal loans, our discount rate assumptions decreased in the fourth quarter due to benchmark rates declining by 90 bps, as well as spreads tightening by 13 bps. For student loans, our discount rate assumptions decreased in the fourth quarter due to benchmark rates declining by 86 bps, as well as spreads widening by 29 bps. Spread changes are indicated by asset-backed security and secondary bond markets.
•Annualized net charge-off rates on personal loans and student loans in the fourth quarter of 2023 were 3.98% and 0.59%, respectively, which remained lower than the assumed weighted average default rates in our fair value model of 4.76% and 0.61%, respectively. Our fair value assumption for annual default rate incorporates fair value markdowns on loans beginning when they are 10 days or more delinquent, with additional markdowns at 30 days, 60 days and 90 days past due. For instance, personal loans are marked down on average 70% when the loans are 30 days past due.
The combination of these and other factors resulted in fair value gains recognized on our personal loans and student loans portfolios during the fourth quarter of 2023.
Student Loan Relief
In June 2023, Congress passed the Fiscal Responsibility Act of 2023 which, among other things, ended the suspension of principal and interest payments on federally-held student loans pursuant to the CARES Act passed in 2020, which became effective 60 days after June 30, 2023, as well as prohibits the Secretary of Education from implementing any extension of any
SoFi Technologies, Inc.
TABLE OF CONTENTS
executive action or rule pursuant thereto. Additionally, in August 2022, President Biden announced relief measures for federal student loan borrowers, including forgiveness of $10,000 of student loans (or up to $20,000 if student loans are Pell Grants) for anyone earning less than $125,000 annually and certain changes to income-driven repayment plans for student loans (the “Biden Forgiveness Program”). Although the U.S. Supreme Court subsequently struck down the Biden Forgiveness Program, President Biden indicated between October 1, 2023 and September 30, 2024, he would allow federal loan borrowers to not be considered delinquent if they miss a payment and that the U.S. Department of Education will not refer borrowers who fail to pay their student loan bills to credit agencies. In addition, on July 14, 2023, President Biden announced that $39 billion in federal student loan debt would be eliminated to remedy mistakes of loan servicers, and other student loan holders will have their loans adjusted. On October 4, 2023, the Biden Administration approved an additional 125,000 borrowers for student loan debt relief, totaling an additional $9 billion in student debt forgiveness.
While we expect we may continue to see an increase in student loan refinancing volume following the end of the federal student loan payment moratorium after August 30, 2023, as borrowers may look to refinance at a lower rate or, given the high interest rate environment, may look to extend the loan term, the timing and impact to our student loan refinancing product will largely depend on expectations regarding the introduction or implementation of additional relief measures, the interest rate environment, how competitive our student loan refinancing products are compared to our competitors and macroeconomic factors.
Key Components of Results of OperationsNet Interest Income
Net interest income primarily reflects the excess of interest income earned on our loans over the interest expense incurred to fund such loans. Net interest income is impacted by loan origination volume, the level of securitization activity, the amount of time we hold loans on our consolidated balance sheet and the volume of member deposits, as well as prevailing interest rates, which impact the rates we receive on our loans and securitization-related investments in bonds and residual interest positions, and the rates we incur from our funding sources including our warehouse facilities, securitization debt and member deposits at SoFi Bank. We also incur interest expense related to our revolving credit facility, as well as on our convertible notes in the form of amortization of debt issuance costs and original issue discount.
Noninterest Income
Noninterest income primarily consists of: (i) revenue recognized from contracts with customers, which primarily relates to our technology products and solutions revenues and has grown due to our recent acquisitions and the growth and expansion of our financial services offerings, (ii) fair value changes in loans while we hold them on our consolidated balance sheet and our securitization activities, inclusive of our hedging activities, (iii) gains on sales of loans transferred into the securitization or whole loan sale channels, (iv) loan origination fees, whereby a borrower may optionally elect to pay origination fees to qualify for a lower annual percentage rate, (v) the income we receive from our loan servicing activities, as well as the assumption of servicing rights from third parties, (vi) gains and losses on non-securitization investments, and (vii) gains and losses on extinguishment of debt.
Noninterest Expense
Noninterest expense primarily relates to the following categories of expenses: (i) technology and product development, (ii) sales and marketing, (iii) cost of operations, and (iv) general and administrative. Certain costs are included within each of these line items, such as compensation and benefits-related expense (inclusive of share-based compensation expense), professional services, depreciation and amortization, and occupancy-related costs. We allocate certain costs to each of these categories based on department-level headcounts. We generally expect these expenses to increase in absolute dollars as our business continues to grow. Noninterest expense also includes the provision for credit losses, which primarily relates to our credit card product, as well as goodwill impairment, related to the Galileo and Technisys reporting units.
Directly Attributable Expenses
As presented within “Summary Results by Segment”, in our determination of the contribution profit (loss) for our reportable segments, we allocate certain expenses that are directly attributable to the segment. Directly attributable expenses primarily include compensation and benefits and sales and marketing, inclusive of member incentives, and vary based on the amount of activity within each segment. Directly attributable expenses also include loan origination and servicing expenses, professional services, product fulfillment and lead generation. Expenses are attributed to the reportable segments using either
SoFi Technologies, Inc.
TABLE OF CONTENTS
direct costs of the segment or labor costs that can be attributed based upon the allocation of employee time for individual products.
Consolidated Results of OperationsThe following table sets forth selected consolidated statements of income data:
Year Ended December 31, 2023 vs. 2022 2022 vs. 2021
($ in thousands) 2023 2022 2021 $ Change % Change $ Change % Change
Net interest income $1,261,740 $584,096 $252,244 $677,644 116 % $331,852 132 %
Total noninterest income 861,049 989,439 732,628 (128,390) (13) % 256,811 35 %
Total net revenue 2,122,789 1,573,535 984,872 549,254 35 % 588,663 60 %
Total noninterest expense 2,423,947 1,892,256 1,466,049 531,691 28 % 426,207 29 %
Loss before income taxes (301,158) (318,721) (481,177) 17,563 (6) % 162,456 (34) %
Income tax benefit (expense) 416 (1,686) (2,760) 2,102 n/m 1,074 (39) %
Net loss $(300,742) $(320,407) $(483,937) $19,665 (6) % $163,530 (34) %
SoFi Technologies, Inc.
TABLE OF CONTENTS
Net Interest Income
The tables below present average balance and interest information for each major category of interest-earning assets and interest-bearing liabilities, along with net interest income and net interest margin.
Average Balances and Net Interest Earnings Analysis
                                                                                                                                                                                                                                                                                                                        Year Ended December 31,
                                                           2023                                                                                                                                                                               2022                                                                                         2021
($ in thousands) Average Balances(1) Interest Income/Expense Average Yield/Rate Average Balances(1) Interest Income/Expense Average Yield/Rate Average Balances(1) Interest Income/Expense Average Yield/Rate
Assets
Interest-earning assets:
Interest-bearing deposits with banks $2,172,013 $91,312 4.20 % $1,122,364 $10,841 0.97 % $706,640 $646 0.09 %
Investment securities 541,590 25,096 4.63 494,005 12,542 2.54 495,444 14,355 2.90
Loans(2) 18,733,812 1,934,659 10.33 9,200,023 749,071 8.14 5,179,729 337,862 6.52
Related party receivables — — — — — — 2,767 211 7.63
Total interest-earning assets 21,447,415 2,051,067 9.56 10,816,392 772,454 7.14 6,384,580 353,074 5.53
Total noninterest-earning assets 3,055,580 2,812,054 1,933,759
Total assets $24,502,995 $13,628,446 $8,318,339
Liabilities, Temporary Equity and Permanent Equity
Interest-bearing liabilities:
Demand deposits $2,214,794 $51,673 2.33 % $1,336,006 $21,814 1.63 % $— $— — %
Savings deposits 8,481,895 359,444 4.24 1,403,750 31,045 2.21 — — —
Time deposits 1,958,002 96,703 4.94 281,633 6,934 2.46 — — —
Total interest-bearing deposits 12,654,691 507,820 4.01 3,021,389 59,793 1.98 — — —
Warehouse facilities 3,142,096 192,987 6.14 2,378,935 71,717 3.01 2,043,085 29,596 1.45
Securitization debt 751,869 36,853 4.90 593,824 22,507 3.79 931,476 35,576 3.82
Other debt(3) 1,638,748 51,526 3.14 1,575,027 30,618 1.94 773,159 27,458 3.55
Total debt 5,532,713 281,366 5.09 4,547,786 124,842 2.75 3,747,720 92,630 2.47
Residual interests classified as debt 12,301 141 1.15 57,510 3,723 6.47 106,990 8,200 7.66
Total interest-bearing liabilities 18,199,705 789,327 4.34 7,626,685 188,358 2.47 3,854,710 100,830 2.62
Total noninterest-bearing liabilities 757,070 657,314 602,994
Total liabilities 18,956,775 8,283,999 4,457,704
Total temporary equity 320,374 320,374 1,637,173
Total permanent equity 5,225,846 5,024,073 2,223,462
Total liabilities, temporary equity and permanent equity $24,502,995 $13,628,446 $8,318,339
Net interest income(4) $1,261,740 $584,096 $252,244
Net interest margin(5) 5.88 % 5.40 % 3.95 %
(1)Average balances were calculated on daily carrying balances for the 2023 period, and on thirteen-month ending carrying balances for the 2022 and 2021 periods, as the daily analysis in the prior periods would have involved undue burden. Both average calculations are representative of our operations.
(2)Interest income on loans measured at amortized cost for the 2022 and 2021 periods includes amortization of deferred loan fees, net of deferred loan costs, which were not material.
(3)Interest expense on other debt primarily includes debt issuance and discount expense, as well as interest expense on the revolving credit facility and seller note, which was repaid in early 2021.
(4)Net interest income is calculated as the excess of total interest income on interest-earning assets over total interest expense on interest-bearing liabilities.
(5)Net interest margin is calculated as net interest income divided by total average interest-earning assets.
2023 vs. 2022. Net interest income increased by $677.6 million, or 116%, during the year ended December 31, 2023 compared to the year ended December 31, 2022, and net interest margin increased by 48 basis points. The increases were primarily driven by higher interest income from (i) personal loans, which was primarily a function of increases in the average balance and origination volume, as well as longer loan holding periods for both personal and student loans, and (ii) interest-
SoFi Technologies, Inc.
TABLE OF CONTENTS
bearing deposits with banks, which reflected our strong liquidity position in a rising interest rate environment. Average interest-earning assets increased by 98%, and average yields increased by 242 basis points.
These increases were partially offset by higher interest expense on deposits attributable to a higher average balance and higher interest rates offered to our members, and higher interest expense on warehouse facilities attributable to a higher average balance and higher interest rates incurred on our facilities, all of which are reflective of the higher interest rate environment year over year.
2022 vs. 2021. Net interest income increased by $331.9 million, or 132%, during the year ended December 31, 2022 compared to the year ended December 31, 2021, primarily driven by higher interest income from non-securitization personal and student loans, which were primarily a function of increases in average balances, higher personal loan origination volume and longer loan holding periods. This increase was partially offset by interest expense on deposits at SoFi Bank during 2022, and lower interest income from consolidated personal and student loan securitizations, which were impacted by decreases in average balances primarily attributable to payment activity and the absence of additions to our consolidated securitization loan balances.
Net interest margin increased by 145 basis points during the year ended December 31, 2022 compared to the year ended December 31, 2021, primarily driven by higher interest-earning assets at higher average yields, particularly related to non-securitization loans, partially offset by higher interest rates paid on warehouse facilities and interest-bearing deposits used to fund our loan originations.
Analysis of Changes in Net Interest Income
The following table presents year-over-year changes in net interest income and the extent to which the variances are attributable to changes in the volume of our interest-earning assets and interest-bearing liabilities or changes in the interest rates related to these assets and liabilities:
                                                                                                                      2023 vs. 2022                                                                          2022 vs. 2021
                                                                                           Increase (Decrease) Due to Change in(1):                                               Increase (Decrease) Due to Change in(1):
($ in thousands) Volume Rate Total Variance Volume Rate Total Variance
Interest income:
Interest-bearing deposits with banks $44,128 $36,343 $80,471 $4,016 $6,179 $10,195
Investment securities 2,205 10,349 12,554 (37) (1,776) (1,813)
Loans 984,564 201,024 1,185,588 327,335 83,874 411,209
Related party receivables — — — — (211) (211)
Total interest income $1,030,897 $247,716 $1,278,613 $331,314 $88,066 $419,380
Interest expense:
Interest-bearing deposits $386,575 $61,452 $448,027 $59,793 $— $59,793
Debt 50,088 106,436 156,524 21,963 10,249 32,212
Residual interests classified as debt (519) (3,063) (3,582) (3,203) (1,274) (4,477)
Total interest expense $436,144 $164,825 $600,969 $78,553 $8,975 $87,528
Net interest income $594,753 $82,891 $677,644 $252,761 $79,091 $331,852
(1)We calculate the change in interest income and interest expense separately for each item. Volume and rate changes have been allocated on a consistent basis using the respective percentage changes in average balances and average rates.
SoFi Technologies, Inc.
TABLE OF CONTENTS
Loan Maturity Schedule
The following table presents the maturities of our loan portfolio, as well as the separate presentation of the total amount of loans in each loan category that are due after one year that have variable rates and fixed rates:
As of December 31, 2023(1)
($ in thousands) Within 1 year After 1 year through 5 years After 5 years through 15 years After 15 years Total
Loan Portfolio:
Personal loans $229,827 $11,758,548 $2,510,254 $— $14,498,629
Student loans 10,153 988,168 3,984,745 1,462,520 6,445,586
Home loans — — — 67,406 67,406
Senior secured loans — 445,733 — — 445,733
Credit card(2) 319,694 — — — 319,694
Commercial and consumer banking 1,565 2,447 12,709 102,242 118,963
Total loans $561,239 $13,194,896 $6,507,708 $1,632,168 $21,896,011
Loans with variable rates:
Personal loans $2,035 $— $— $2,035
Student loans 18,906 80,526 9,769 109,201
Commercial and consumer banking 679 5,532 97,070 103,281
Total loans $21,620 $86,058 $106,839 $214,517
Loans with fixed rates:
Personal loans $11,756,513 $2,510,254 $— $14,266,767
Student loans 969,262 3,904,219 1,452,751 6,326,232
Home loans — — 67,406 67,406
Senior secured loans 445,733 — — 445,733
Commercial and consumer banking 1,768 7,177 5,172 14,117
Total loans $13,173,276 $6,421,650 $1,525,329 $21,120,255
(1)Maturities presented are based upon the contractual terms of the loans. Amounts represent unpaid principal balance of loans outstanding at period end.
(2)Due to the revolving nature of credit cards, we report all of our credit card balances as due within one year.
Noninterest Income and Net Revenue
The following table presents the components of our total noninterest income, as well as total net revenue:
Year Ended December 31, 2023 vs. 2022 2022 vs. 2021
($ in thousands) 2023 2022 2021 $ Change % Change $ Change % Change
Loan origination, sales, and securitizations $371,812 $565,372 $482,764 $(193,560) (34) % $82,608 17 %
Servicing 37,328 43,547 (2,281) (6,219) (14) 45,828 n/m
Technology products and solutions 323,972 304,901 191,847 19,071 6 113,054 59
Other 127,937 75,619 60,298 52,318 69 15,321 25
Total noninterest income $861,049 $989,439 $732,628 $(128,390) (13) $256,811 35
Total net revenue $2,122,789 $1,573,535 $984,872 $549,254 35 % $588,663 60 %
2023 vs. 2022. Total noninterest income decreased by $128.4 million, or 13%, for the year ended December 31, 2023 compared to the year ended December 31, 2022, which was primarily attributable to: (i) higher personal loan write-offs in 2023, (ii) higher origination fees primarily related to a new product feature offered on personal loans, whereby a borrower may optionally elect to pay origination fees to qualify for a lower annual percentage rate, (iii) the net effect of higher income related to in period originations, loan sale execution and fair value adjustments on loans and securitization loans, which were primarily impacted by higher personal loan origination volume, lower student loan prepayment assumptions, and an increase in securitization loan fair market values primarily associated with a consolidated securitization transaction in the first quarter of 2023, partially offset by losses in 2023 compared to gains in 2022 on loan hedging and risk retention hedge activities due to smaller increases in interest rates during the 2023 period, (iv) growth in technology products and solutions fees largely driven
SoFi Technologies, Inc.
TABLE OF CONTENTS
by revenue contribution from Technisys for the full period in 2023, (v) increased interchange revenue, and (vi) gain on extinguishment of debt during 2023.
2022 vs. 2021. Total noninterest income increased by $256.8 million, or 35%, for the year ended December 31, 2022 compared to the year ended December 31, 2021, primarily driven by loan hedging activities due to higher interest rates in 2022, partially offset by lower income related to in period originations, loan sale execution and fair value adjustments on loans, as well as higher loan write offs. The increase was also attributable to growth in technology products and solutions fees driven by account growth and increased activity among our existing integrated technology solutions clients combined with revenue contribution from the Technisys Merger in 2022.
Noninterest Expense
The following table presents the components of our total noninterest expense:
Year Ended December 31, 2023 vs. 2022 2022 vs. 2021
($ in thousands) 2023 2022 2021 $ Change % Change $ Change % Change
Technology and product development $511,419 $405,257 $276,087 $106,162 26 % $129,170 47 %
Sales and marketing 719,400 617,823 426,875 101,577 16 190,948 45
Cost of operations 379,998 313,226 256,980 66,772 21 56,246 22
General and administrative 511,011 501,618 498,534 9,393 2 3,084 1
Goodwill impairment 247,174 — — 247,174 n/m — n/m
Provision for credit losses 54,945 54,332 7,573 613 1 46,759 617
Total noninterest expense $2,423,947 $1,892,256 $1,466,049 $531,691 28 % $426,207 29 %
2023 vs. 2022. Total noninterest expense increased by $531.7 million, or 28%, for the year ended December 31, 2023 compared to the year ended December 31, 2022, primarily driven by: (i) goodwill impairment expense related to the Galileo and Technisys reporting units, further discussed within “Critical Accounting Policies and Estimates—Goodwill”, (ii) higher employee compensation and benefits, which was attributable to increases in headcount and salary and the inclusion of Technisys for the full 2023 period compared to a partial period in 2022, related to support of our growth and impacts of the inflationary environment, as well as restructuring charges during the first and fourth quarters of 2023 and partially offset by decreases in share-based compensation expense, (iii) increases in advertising and marketing expenditures, utilization of lead generation channels and direct member incentives, (iv) increased amortization of purchased and internally-developed software, and in tools and subscriptions costs, reflective of continued investments in technology, (v) an increase in product fulfillment costs, which included debit card fulfillment services, primarily related to our SoFi Money product, as well as payment processing network association fees associated with increased activity on our technology platform, and (vi) increases in amortization of intangible assets primarily due to acquired intangible assets in the Technisys Merger and Wyndham acquisition. These increases were partially offset by the absence of transaction expenses that were incurred in the 2022 period related to our acquisition of Technisys.
2022 vs. 2021. Total noninterest expense increased by $426.2 million, or 29%, for the year ended December 31, 2022 compared to the year ended December 31, 2021, primarily driven by: (i) higher employee compensation and benefits (inclusive of an increase in share-based compensation expense), a portion of which was attributable to the Technisys Merger and the remainder of which was related to increased personnel to support our growth in 2022, (ii) increases in advertising expenditures and utilization of lead generation channels, (iii) an increase in the provision for credit losses, which reflected higher average credit card balances combined with elevated credit card loss rates during 2022, (iv) an increase in amortization of intangible assets due to acquired intangible assets in the Technisys Merger, and (v) an increase in purchased and internally-developed software amortization, reflective of continued investments in technology.
SoFi Technologies, Inc.
TABLE OF CONTENTS
Provision for Credit Losses
Analysis of Allowance for Credit Losses
Allowance for Credit Losses Ratios
The following table presents the ratio of allowance for credit losses to total loans outstanding that are measured at amortized cost:
December 31,
($ in thousands) 2023 2022
Allowance for credit losses to total loans outstanding
Allowance for credit losses $54,695 $40,788
Total loans held for investment, at amortized cost outstanding(1) $884,390 $344,106
Ratio(2) 6.18 % 11.85 %
(1)Total loans outstanding excludes accrued interest.
(2)The decrease in the ratio was primarily attributable to senior secured loans, for which we did not recognize an allowance for credit losses, partially offset by credit cards, which was primarily reflective of an increase in the average balance combined with elevated loss rates.
We omitted the credit ratios associated with nonaccrual loans, as the balance of nonaccrual loans was immaterial.
Allocation of Allowance for Credit Losses
The following table presents the allocation of the allowance for credit losses and the percentage of loans outstanding by category to total loans outstanding that are measured at amortized cost:
December 31, 2023 December 31, 2022
($ in thousands) Allowance for credit losses Percent of loans to total loans(1) Allowance for credit losses Percent of loans to total loans(1)
Credit card $52,385 36 % $39,110 71 %
Commercial and consumer banking 2,310 13 1,678 29
Senior secured loans(2) — 51 — —
Total $54,695 100 % $40,788 100 %
(1)Loans outstanding balances used in the calculation exclude accrued interest.
(2)For the periods presented, we did not recognize an allowance for credit losses on senior secured loans, as we determined that our expected exposure to credit losses was immaterial.
Analysis of Charge-offs
The following tables present information regarding average loans outstanding, net charge-offs and the annualized ratio of net charge-offs to average loans outstanding:
                                                                                                                                                                                                                                                                                             Year Ended December 31,
                                   2023                                                                                                                                                                               2022                                                                                      2021
($ in thousands) Average Loans(1) Net Charge-offs(2) Ratio Average Loans(1) Net Charge-offs(2) Ratio Average Loans(1) Net Charge-offs(2) Ratio
Personal loans $12,638,807 $432,706 3.42 % $4,767,708 $88,511 1.86 % $1,968,297 $19,398 0.99 %
Student loans 5,641,787 25,048 0.44 4,059,001 12,677 0.31 2,964,404 9,399 0.32
Home loans 78,554 — — 132,663 — — 197,452 — —
Senior secured loans 26,291 — — — — — — — —
Credit card(3) 238,832 40,992 17.16 167,290 20,957 12.53 47,533 2,048 4.31
Commercial and consumer banking 109,541 46 0.04 73,361 7 0.01 2,043 — —
Total loans $18,733,812 $498,792 2.66 % $9,200,023 $122,152 1.33 % $5,179,729 $30,845 0.60 %
SoFi Technologies, Inc.
TABLE OF CONTENTS
(1)Average balances were calculated on daily carrying balances for the 2023 period, and on thirteen-month ending carrying balances for the 2022 and 2021 periods, as the daily analysis in the prior periods would have involved undue burden. Both average calculations are representative of our operations.
(2)Net charge-offs include both credit- and certain non-credit-related charge-offs.
(3)The increase in the net charge-off rate associated with credit card was primarily related to our maturing portfolio.
2022 vs. 2021. The provision for credit losses increased by $46.8 million, which primarily reflected higher average credit card balances combined with elevated credit card loss rates during 2022.
Income Taxes
For the years ended December 31, 2023, 2022 and 2021, we recorded income tax benefit (expense) of $0.4 million, $(1.7) million, and $(2.8) million, respectively. Our income tax benefit position in 2023 was primarily attributable to income tax benefits from foreign losses in jurisdictions with net deferred tax liabilities related to Technisys. These benefits were offset by income tax expense associated with the profitability of SoFi Bank in state jurisdictions where separate filings are required, as well as federal taxes where our tax credits and loss carryforwards may be limited. Our income tax expense position in 2022 was primarily attributable to tax expense at SoFi Lending Corp. and SoFi Bank due to profitability in state jurisdictions where separate filings are required and recognition of expense from Technisys in certain Latin American countries where separate returns are filed. The expense was partially offset by deferred tax benefits from the amortization of intangible assets acquired in the Technisys Merger.
Summary Results by SegmentContribution profit (loss) is the primary measure of segment-level profit and loss that, along with our key business metrics, is used by management to evaluate our business, measure our performance, identify trends and make strategic decisions. Contribution profit (loss) is defined as total net revenue for each reportable segment less expenses directly attributable to the reportable segment and, in the case of our Lending segment, adjusted for fair value adjustments attributable to assumption changes associated with our servicing rights and residual interests classified as debt. See the sections entitled “Consolidated Results of Operations”, “Summary Results by Segment” and “Non-GAAP Financial Measures” for discussion and analysis of these key financial measures.
Lending Segment
In the table below, we present certain metrics related to our Lending segment:
December 31, 2023 vs. 2022 2022 vs. 2021
Metric 2023 2022 2021 Change % Change Change % Change
Total products (number, as of period end) 1,663,006 1,340,597 1,078,952 322,409 24 % 261,645 24 %
Origination volume ($ in thousands, during period)
Personal loans $13,801,065 $9,773,705 $5,386,934 $4,027,360 41 % $4,386,771 81 %
Student loans 2,630,040 2,245,499 4,293,526 384,541 17 % (2,048,027) (48) %
Home loans 997,492 966,177 2,978,222 31,315 3 % (2,012,045) (68) %
Total $17,428,597 $12,985,381 $12,658,682 $4,443,216 34 % $326,699 3 %
Loans with a balance (number, as of period end)(1) 1,009,433 753,043 603,201 256,390 34 % 149,842 25 %
Average loan balance ($, as of period end)(1)
Personal loans $24,223 $24,917 $22,820 $(694) (3) % $2,097 9 %
Student loans(2) 44,683 46,585 50,549 (1,902) (4) % (3,964) (8) %
Home loans 284,289 285,152 286,991 (863) — % (1,839) (1) %
(1)Loans with a balance and average loan balance include loans on our balance sheet, as well as transferred loans and referred loans with which we have a continuing involvement through our servicing agreements.
(2)In-school loans carry a lower average balance than student loan refinancing products.
Total Products
Total products in our Lending segment is a subset of our total products metric. See “Key Business Metrics” for further discussion of this measure as it relates to our Lending segment.
SoFi Technologies, Inc.
TABLE OF CONTENTS
Origination Volume
We refer to the aggregate dollar amount of loans originated through our platform in a given period as origination volume. Origination volume is an indicator of the size and health of our Lending segment and an indicator (together with the relevant loan characteristics, such as interest rate and prepayment and default expectations) of revenues and profitability. Changes in origination volume are driven by the addition of new members and existing members, the latter of which at times will either refinance into a new SoFi loan or secure an additional, concurrent loan, as well as macroeconomic factors impacting consumer spending and borrowing behavior. Since the profitability of the Lending segment is largely correlated with origination volume, management relies on origination volume trends to assess the need for external financing to support the Financial Services segment and the expense budgets for unallocated expenses.
Personal Loans. During the year ended December 31, 2023, personal loan origination volume increased significantly relative to 2022, primarily due to increased demand driven by expanded marketing efforts and increased demand for debt consolidation products in a rising interest rate environment.
Personal loan origination volume increased significantly during the year ended December 31, 2022 compared to 2021, primarily due to increased demand driven by expanded marketing efforts and increased demand for debt consolidation products in a rising interest rate environment. This was combined with a positive impact from increased loan application approval rates within our existing credit parameters that were implemented during the second half of 2021 and maintained through mid-2022, with slight credit tightening implemented in the second half of 2022.
Student Loans. During the year ended December 31, 2023, student loan origination volume increased relative to 2022, as demand for student loan refinancing products increased ahead of the resumption of principal and interest payments on federally-held student loans as borrowers looked to refinance at a lower rate or, given the high interest rate environment, to extend the loan term. This was partially offset by the unfavorable impact of the suspension of principal and interest payments on federally-held student loans through August 30, 2023 and the expectation of debt cancellation for certain federal student loan borrowers which was struck down by the U.S. Supreme Court in June 2023, combined with a continued rising interest rate environment in 2023.
Student loan origination volume decreased significantly during the year ended December 31, 2022 compared to 2021, as demand for student loan refinancing products continued to be unfavorably impacted by the ongoing suspension of principal and interest payments on federally-held student loans and the expectation of debt cancellation for certain federal student loan borrowers, combined with a rising interest rate environment in 2022.
Home Loans. During the year ended December 31, 2023, home loan origination volume remained relatively flat relative to 2022 due to continued rising interest rates, which tends to lower demand for home loans overall and shift demand from refinance originations to purchase originations, the latter of which is a more competitive landscape. Although purchase originations historically represented a smaller percentage of our home loan originations, our mix during the 2023 period has shifted toward more purchase originations, which we would expect to continue under similar macroeconomic conditions. Our home loan origination volume increased notably beginning in the second quarter of 2023, aided by the increased capacity and capabilities subsequent to our acquisition of Wyndham.
Home loan origination volume decreased significantly during the year ended December 31, 2022 compared to 2021 due to continued rising interest rates relative to 2021 levels, which tends to lower demand for home loans overall and shift demand from refinance originations to purchase originations, the latter of which is a more competitive landscape. Although purchase originations have historically represented a smaller percentage of our home loan originations, our mix has shifted toward more purchase originations in the second half of 2022.
Loans with a Balance and Average Loan Balance
Loans with a balance refers to the number of loans that have a balance greater than zero dollars as of the reporting date. Loans with a balance allows management to better understand the unit economics of acquiring a loan in relation to the lifetime value of that loan. Average loan balance is defined as the total unpaid principal balance of the loans divided by loans with a balance within the respective loan product category as of the reporting date. Average loan balance tends to fluctuate based on the pace of loan originations relative to loan repayments and the initial loan origination size.
SoFi Technologies, Inc.
TABLE OF CONTENTS
In the table below, we present additional information related to our lending products:
Year Ended December 31,
($ in thousands) 2023 2022 2021
Overall weighted average origination FICO 749 752 761
Personal Loans
Weighted average origination FICO 745 747 754
Weighted average interest rate earned(1) 13.28 % 11.82 % 10.64 %
Interest income recognized $1,600,527 $551,458 $202,706
Sales of loans $938,403 $2,911,491 $4,290,424
Student Loans
Weighted average origination FICO 770 773 774
Weighted average interest rate earned(1) 5.13 % 4.27 % 4.44 %
Interest income recognized $281,921 $170,550 $127,496
Sales of loans $96,678 $877,920 $2,854,778
Home Loans
Weighted average origination FICO 755 749 755
Weighted average interest rate earned(1) 5.76 % 3.42 % 1.96 %
Interest income recognized $4,982 $4,714 $3,778
Sales of loans $1,029,214 $1,094,981 $2,935,038
(1)Weighted average interest rate earned represents annualized interest income recognized divided by the average of the unpaid principal balances of loans outstanding during the period, determined on a daily basis for the 2023 period and on a thirteen-month basis for the 2022 and 2021 periods, as the daily analysis in the prior period would have involved undue burden. Both average calculations are representative of our operations.
Lending Segment Results of Operations
The following table presents the measure of contribution profit for the Lending segment.
Year Ended December 31, 2023 vs. 2022 2022 vs. 2021
($ in thousands) 2023 2022 2021 $ Change % Change $ Change % Change
Net interest income $960,773 $531,480 $258,102 $429,293 81 % $273,378 106 %
Noninterest income 409,848 608,511 480,221 (198,663) (33) % 128,290 27 %
Total net revenue 1,370,621 1,139,991 738,323 230,630 20 % 401,668 54 %
Servicing rights – change in valuation inputs or assumptions(1) (34,700) (39,651) 2,651 4,951 (12) % (42,302) n/m
Residual interests classified as debt – change in valuation inputs or assumptions(2) 425 6,608 22,802 (6,183) (94) % (16,194) (71) %
Directly attributable expenses (513,073) (442,945) (364,169) (70,128) 16 % (78,776) 22 %
Contribution profit $823,273 $664,003 $399,607 $159,270 24 % $264,396 66 %
Adjusted net revenue(3) $1,336,346 $1,106,948 $763,776 $229,398 21 % $343,172 45 %
(1)Reflects changes in fair value inputs and assumptions, including market servicing costs, conditional prepayment, default rates and discount rates. This non-cash change, which is recorded within noninterest income in the consolidated statements of operations and comprehensive loss is unrealized during the period and, therefore, has no impact on our cash flows from operations. As such, the changes in fair value attributable to assumption changes are adjusted to provide management and financial users with better visibility into the cash flows available to finance our operations.
(2)Reflects changes in fair value inputs and assumptions, including conditional prepayment, default rates and discount rates. When third parties finance our consolidated VIEs through purchasing residual interests, we receive proceeds at the time of the securitization close and, thereafter, pass along contractual cash flows to the residual interest owner. These obligations are measured at fair value on a recurring basis, with fair value changes recorded within noninterest income in the consolidated statements of operations and comprehensive loss. The fair value change attributable to assumption changes has no impact on our initial financing proceeds, our future obligations to the residual interest owner (because future residual interest claims are limited to contractual securitization collateral cash flows), or the general operations of our business. As such, this non-cash change in fair value is adjusted to provide management and financial users with better visibility into the cash flows available to finance our operations.
(3)Adjusted net revenue is a non-GAAP financial measure. For information regarding our use and definition of this measure and for a reconciliation to the most directly comparable U.S. GAAP measure, total net revenue, see “Non-GAAP Financial Measures” herein.
Net interest income
2023 vs. 2022. Net interest income in our Lending segment increased by $429.3 million, or 81%, for the year ended December 31, 2023 compared to 2022, which was primarily attributable to increases in average personal and student loan unpaid principal balances of $7.0 billion, or 161%, and $1.7 billion, or 49%, respectively, combined with a higher weighted
SoFi Technologies, Inc.
TABLE OF CONTENTS
average interest rate. The personal loan average balance increase was primarily attributable to higher origination volume and longer loan holding periods. The student loan average balance increase was primarily attributable to longer loan holding periods. Interest expense associated with funding our lending activities increased by $732.1 million, or 356%, primarily due to the sharp increases in benchmark rates which are reflective of the higher interest rate environment year over year, as well as higher average loan balances.
2022 vs. 2021. Net interest income in our Lending segment increased by $273.4 million, or 106%, for the year ended December 31, 2022 compared to 2021, which was primarily attributable to non-securitization loans. Higher interest income on non-securitization personal loans and student loans was primarily a function of increases in aggregate average balances of $2.8 billion, or 185%, and $1.3 billion, or 62%, respectively. The personal loan average balance increase was primarily attributable to higher origination volume and purchase activity combined with a higher weighted average interest rate earned on whole loans and longer loan holding periods. The student loan average balance increase was primarily attributable to longer loan holding periods, partially offset by a lower weighted average interest rate earned on whole loans. Interest expense associated with funding our lending activities, which was determined using an FTP framework in 2022 and was based on actual interest expense on our use of securitizations and warehouse facilities in 2021, increased by $115.6 million, or 128%, year over year, primarily due to the sharp increase in benchmark rates.
Noninterest income
2023 vs. 2022. Noninterest income in our Lending segment decreased by $198.7 million, or 33%, for the year ended December 31, 2023 compared to 2022, which was primarily driven by lower loan origination, sales, and securitizations income of $193.3 million.
2022 vs. 2021. Noninterest income in our Lending segment increased by $128.3 million, or 27%, for the year ended December 31, 2022 compared to 2021, which was primarily driven by higher loan origination, sales, and securitizations income of $82.4 million and higher servicing income of $45.6 million.
Loan Originations, Sales, and Securitizations
The following table presents the components of noninterest income—loan origination, sales, and securitizations:
Year Ended December 31, 2023 vs. 2022 2022 vs. 2021
($ in thousands) 2023 2022 2021 $ Change % Change $ Change % Change
In period originations, loan sale execution and fair value adjustments(1) $689,956 $295,562 $450,695 $394,394 133 % $(155,133) (34) %
Economic derivative hedges of loan fair values (11,258) 369,898 49,090 (381,156) n/m 320,808 654 %
Other derivative instruments(2) 7,560 (11,032) (2,742) 18,592 n/m (8,290) 302 %
Loan origination fees 134,399 7,452 14,452 126,947 n/m (7,000) (48) %
Loan write-off expense – whole loans(3) (455,194) (101,188) (28,797) (354,006) 350 % (72,391) 251 %
Loan repurchase (expense) benefit(4) (2,075) 4,460 (3,117) (6,535) n/m 7,577 n/m
Other 8,453 (10) 3,183 8,463 n/m (3,193) n/m
Loan origination, sales, and securitizations noninterest income $371,841 $565,142 $482,764 $(193,301) (34) % $82,378 17 %
(1)Includes fair value adjustments on loans originated during the period, fair value adjustments of loans and securitization bond and residual interest positions held at the balance sheet date, as well as gains (losses) on loans sold and consolidated securitization transactions during the period. Fair value adjustments are impacted by interest rates, weighted average coupon, credit spreads and loss estimates, prepayment speeds, duration and previous loan sale execution on similar loans.
(2)Includes IRLCs, interest rate caps and purchase price earn-out.
(3)For the years ended December 31, 2023, 2022 and 2021, includes gross write-offs of $533.3 million, $131.6 million and $48.7 million, respectively. Total recoveries were $78.1 million, $30.4 million and $19.9 million, respectively, of which $53.7 million, $10.5 million and $5.3 million, respectively, were captured via loan sales to a third-party collection agency.
(4)Represents the (expense) benefit associated with our estimated loan repurchase obligation. See Note 18. Commitments, Guarantees, Concentrations and Contingencies to the Notes to Consolidated Financial Statements for additional information.
2023 vs. 2022. The decrease in loan origination, sales, and securitizations income was primarily driven by: (i) higher personal loan write-offs in the 2023 period, primarily driven by longer loan holding periods and elevated charge off rates, (ii) losses in 2023 compared to gains in 2022 on student loan, personal loan and risk retention interest rate swap positions primarily
SoFi Technologies, Inc.
TABLE OF CONTENTS
driven by smaller increases in interest rates during the 2023 period, and (iii) lower gains on home loan pipeline hedges primarily driven by larger increases in the underlying hedge price index during the 2023 period.
These decreases were partially offset by: (i) higher fair value gains on personal loans and lower fair value losses on student loans in the 2023 period, which were primarily impacted by higher origination volume and lower prepayment assumptions, respectively, (ii) higher origination fees primarily related to a new product feature offered on personal loans, whereby a borrower may optionally elect to pay origination fees to qualify for a lower annual percentage rate, (iii) improvement in securitizations income primarily driven by an increase in securitization loan and residual interests in securitization trusts fair market values primarily associated with consolidated securitization transactions in the first and third quarters of 2023, and a positive variance in our securitization bond and residual interest position fair values, (iv) fair value gains on home loans (compared to losses in the 2022 period), which were primarily impacted by smaller decreases in benchmark rates, and (v) losses on home loan and student loan sale execution in the 2022 period, which were due to both volume and price factors.
2022 vs. 2021. The increase in loan origination, sales, and securitizations income was primarily driven by: (i) gains on student loan, personal loan and risk retention interest rate swap positions primarily driven by higher interest rates in 2022, (ii) fair value gains on personal loan originations in the year, partially offset by fair value losses on student loan and home loan originations in the year, each correlated with origination volume, (iii) gains on home loan pipeline hedges due to decreases in the underlying hedge price index, and (iv) favorable changes in residual debt fair value adjustments. This increase was partially offset by: (i) lower fair value marks on loans held on balance sheet at period end (including in period originations) across all loan products, primarily driven by deterioration in general market conditions, (ii) lower execution prices on sales activity across all loan products, due to both volume and price factors, (iii) higher loan write offs, primarily driven by higher average personal loan balances and elevated charge off rates in 2022, (iv) a decrease in securitization loan fair market value changes, principally due to increases in market interest rates, and (v) a decline in securitization bond fair values that were impacted by the interest rate volatility during the 2022 period.
Servicing
We own the master servicing on all of the servicing rights that we retain and, in each case, recognize the gross servicing rate applicable to each serviced loan. Sub-servicers are utilized for all serviced student loans and home loans, which represents a cost to SoFi, but these arrangements do not impact our calculation of the weighted average basis points earned for each loan type serviced. Further, there is no impact on servicing income due to forbearance and moratoriums on certain debt collection activities, and there are no waivers of late fees. The table below presents information related to our loan servicing activities:
Year Ended December 31, 2023 vs. 2022 2022 vs. 2021
($ in thousands) 2023 2022 2021 $ Change % Change $ Change % Change
Servicing income recognized
Personal loans $24,074 $35,653 $34,093 $(11,579) (32) % $1,560 5 %
Student loans 25,174 36,256 46,519 (11,082) (31) % (10,263) (22) %
Home loans 15,161 12,965 8,975 2,196 17 % 3,990 44 %
Servicing rights fair value change
Personal loans $28,839 $(4,245) $2,677 $33,084 n/m $(6,922) n/m
Student loans (4,929) (24,058) (10,634) 19,129 (80) % (13,424) 126 %
Home loans 6,705 9,898 26,619 (3,193) (32) % (16,721) (63) %
2022 vs. 2021. The increase in servicing income was primarily related to favorable changes in valuation inputs and assumptions for student loans, which was primarily attributable to decreased prepayment rate assumptions during 2022 compared to increased assumptions during 2021, partially offset by increased discount rate assumptions during 2022.
SoFi Technologies, Inc.
TABLE OF CONTENTS
Directly attributable expenses
The directly attributable expenses allocated to the Lending segment that were used in the determination of the segment's contribution profit were as follows:
Year Ended December 31, 2023 vs. 2022 2022 vs. 2021
($ in thousands) 2023 2022 2021 $ Change % Change $ Change % Change
Direct advertising $183,885 $178,263 $126,367 $5,622 3 % $51,896 41 %
Compensation and benefits 119,266 103,996 88,137 15,270 15 % 15,859 18 %
Lead generation 115,388 87,716 55,170 27,672 32 % 32,546 59 %
Loan origination and servicing costs 46,241 41,535 56,242 4,706 11 % (14,707) (26) %
Professional services 9,592 6,649 5,663 2,943 44 % 986 17 %
Intercompany technology platform expenses 948 — — 948 n/m — n/m
Other(1) 37,753 24,786 32,590 12,967 52 % (7,804) (24) %
Directly attributable expenses $513,073 $442,945 $364,169 $70,128 16 % $78,776 22 %
(1)Other expenses primarily include loan marketing expenses, member promotional expenses, tools and subscriptions, travel and occupancy-related costs, and third-party loan fraud (net of related insurance recoveries).
2023 vs. 2022. Lending segment directly attributable expenses increased by $70.1 million, or 16%, for the year ended December 31, 2023 compared to 2022, primarily due to: (i) an increase in personal loan lead generation channels during 2023, (ii) an increase in allocated compensation and related benefits, which reflected increases in average compensation and average headcount in 2023, (ii) an increase in direct advertising primarily related to direct mail advertising, and (iv) an increase in other expenses, primarily related to loan marketing expenses and third-party loan fraud.
2022 vs. 2021. Lending segment directly attributable expenses increased by $78.8 million, or 22%, for the year ended December 31, 2022 compared to 2021, primarily due to: (i) an increase in direct advertising primarily related to direct mail, search engine and social network advertising, partially offset by declines in television advertisement; (ii) increasing utilization of lead generation channels primarily associated with increased personal loan origination volume in 2022; (iii) an increase in allocated compensation and related benefits, which primarily reflected increases in headcount allocated to the Lending segment and increased average compensation in 2022, partially offset by decreases in home loan commissions attributable to decreases in home loan originations; and (iv) a decrease in loan origination and servicing costs, which were largely attributable to decreases in home loan origination costs, partially offset by increases in personal loan origination costs, each of which was correlated with origination volumes.
SoFi Technologies, Inc.
TABLE OF CONTENTS
Transfers of Financial Assets
We regularly transfer financial assets and account for such transfers as either sales or secured borrowings depending on the facts and circumstances of the transfer. The following table summarizes our whole loan sales:
Year Ended December 31,
2023 2022 2021
Personal loans
Fair value of consideration received:
Cash $567,904 $3,016,740 $3,373,655
Servicing assets recognized 30,168 21,925 21,811
Repurchase liabilities recognized (2,069) (7,351) (8,168)
Total consideration received 596,003 3,031,314 3,387,298
Aggregate unpaid principal balance and accrued interest of loans sold 567,003 2,924,567 3,253,645
Realized gain $29,000 $106,747 $133,653
Sale execution(1) 105.5 % 103.9 % 104.4 %
Student loans
Fair value of consideration received:
Cash $98,624 $883,859 $1,676,892
Servicing assets recognized 2,792 9,275 15,526
Repurchase liabilities recognized (16) (134) (300)
Total consideration 101,400 893,000 1,692,118
Aggregate unpaid principal balance and accrued interest of loans sold 99,916 881,922 1,635,280
Realized gain $1,484 $11,078 $56,838
Sale execution(1) 101.5 % 101.3 % 103.5 %
Home loans
Fair value of consideration received:
Cash $1,022,600 $1,057,596 $2,989,813
Servicing assets recognized 10,184 13,926 31,294
Repurchase liabilities recognized (1,765) (1,158) (3,288)
Total consideration 1,031,019 1,070,364 3,017,819
Aggregate unpaid principal balance and accrued interest of loans sold 1,029,623 1,095,882 2,935,343
Realized gain (loss) $1,396 $(25,518) $82,476
Sale execution(1) 100.3 % 97.8 % 102.9 %
(1)Sale execution represents the ratio of cash proceeds and servicing assets recognized to the aggregate unpaid principal balance and accrued interest of the loans sold. Amounts included in repurchase liabilities are excluded from the calculation, as they typically would not materially differ from the fair value markdown on the loans over the repurchase period had they been held on balance sheet and entered delinquency.
Technology Platform Segment
In the table below, we present the total accounts metric related to Galileo within our Technology Platform segment:
                                                                                      December 31,                                   2023 vs. 2022                                   2022 vs. 2021
                 2023                        2022                        2021                                  $ Change                   % Change             $ Change                   % Change
Total accounts 145,425,391 130,704,351 99,660,657 14,721,040 11 % 31,043,694 31 %
See “Key Business Metrics” for further discussion of this measure as it relates to our Technology Platform segment.
SoFi Technologies, Inc.
TABLE OF CONTENTS
Technology Platform Segment Results of Operations
The following table presents the measure of contribution profit for the Technology Platform segment.
Year Ended December 31, 2023 vs. 2022 2022 vs. 2021
($ in thousands) 2023 2022 2021 $ Change % Change $ Change % Change
Net interest income (expense) $1,514 $— $(29) $1,514 n/m $29 (100) %
Noninterest income 350,826 315,133 194,915 35,693 11 % 120,218 62 %
Total net revenue 352,340 315,133 194,886 37,207 12 % 120,247 62 %
Directly attributable expenses (257,554) (238,620) (130,439) (18,934) 8 % (108,181) 83 %
Contribution profit $94,786 $76,513 $64,447 $18,273 24 % $12,066 19 %
Net interest income
Net interest income in our Technology Platform segment in 2023 relates to interest income earned on segment cash balances, which we began recording within the Technology Platform segment in the third quarter of 2023. Prior period amounts were determined to be immaterial, and presented within Corporate/Other.
Noninterest income
2023 vs. 2022. Noninterest income in our Technology Platform segment increased by $35.7 million, or 11%, for the year ended December 31, 2023 compared to 2022. The increase was primarily attributable to growth in technology products and solutions fees driven by revenue contribution from Technisys for the full 2023 period compared to ten months of 2022. Noninterest income also included $22.2 million and $7.6 million of intercompany revenue for the years ended December 31, 2023 and 2022, respectively. The increase in intercompany revenue was primarily attributable to increased usage of technology platform services during the 2023 periods by our Financial Services segment, as well as within our Technology Platform segment, as we continue to leverage synergies to enhance our product offerings.
2022 vs. 2021. Noninterest income in our Technology Platform segment increased by $120.2 million, or 62%, for the year ended December 31, 2022 compared to 2021, of which $69.2 million was attributable to revenue contribution from the Technisys Merger in 2022. The remaining increase was primarily attributable to growth in technology products and solutions fees driven by account growth and increased activity among our existing integrated technology solutions clients. Noninterest income included $7.6 million and $1.9 million of intercompany revenue for the years ended December 31, 2022 and 2021, respectively.
Directly attributable expenses
The directly attributable expenses allocated to the Technology Platform segment that were used in the determination of the segment's contribution profit were as follows:
Year Ended December 31, 2023 vs. 2022 2022 vs. 2021
($ in thousands) 2023 2022 2021 $ Change % Change $ Change % Change
Compensation and benefits $151,041 $143,843 $68,277 $7,198 5 % $75,566 111 %
Product fulfillment 47,731 39,237 31,492 8,494 22 % 7,745 25 %
Tools and subscriptions 26,384 21,745 9,544 4,639 21 % 12,201 128 %
Professional services 13,230 11,460 6,037 1,770 15 % 5,423 90 %
Other(1) 19,168 22,335 15,089 (3,167) (14) % 7,246 48 %
Directly attributable expenses $257,554 $238,620 $130,439 $18,934 8 % $108,181 83 %
(1)Other expenses are primarily related to travel and occupancy-related costs, advertising and marketing, and data center costs.
2023 vs. 2022. Technology Platform segment directly attributable expenses increased by $18.9 million, or 8%, for the year ended December 31, 2023 compared to 2022, primarily due to: (i) an increase in product fulfillment costs, primarily related to payment processing network association fees associated with increased activity on the platform, (ii) an increase in compensation and benefits expense, primarily related to bonus adjustments in the second quarter of 2023 and the inclusion of Technisys in our results for the full 2023 period, partially offset by a decrease in average headcount in 2023 corresponding with restructuring during the first quarter of 2023, and (iii) an increase in tools and subscriptions costs related to internal technology initiatives to support the growth of the platform, along with the inclusion of Technisys in our results for the full 2023 period.
SoFi Technologies, Inc.
TABLE OF CONTENTS
2022 vs. 2021. Technology Platform segment directly attributable expenses increased by $108.2 million, or 83%, for the year ended December 31, 2022 compared to 2021, primarily due to: (i) an increase in compensation and benefits expense, which was correlated with an increase in personnel to support segment growth and of which Technisys compensation and benefits contributed $53.0 million during 2022; and (ii) an increase in tools and subscriptions costs related to headcount increases and internal technology initiatives to support the growth of the platform, along with the inclusion of Technisys in our 2022 results.
Financial Services Segment
In the table below, we present the total products metric related to our Financial Services segment:
                                                                                December 31,                                 2023 vs. 2022                                 2022 vs. 2021
                 2023                      2022                      2021                              $ Change                   % Change           $ Change                   % Change
Total products 9,479,470 6,554,039 4,094,245 2,925,431 45 % 2,459,794 60 %
Total products in our Financial Services segment is a subset of our total products metric. See “Key Business Metrics” for a further discussion of this measure as it relates to our Financial Services segment.
Financial Services Segment Results of Operations
The following table presents the measure of contribution loss for the Financial Services segment.
Year Ended December 31, 2023 vs. 2022 2022 vs. 2021
($ in thousands) 2023 2022 2021 $ Change % Change $ Change % Change
Net interest income(1) $334,847 $92,574 $3,765 $242,273 262 % $88,809 n/m
Noninterest income 101,668 75,102 54,313 26,566 35 % 20,789 38 %
Total net revenue 436,515 167,676 58,078 268,839 160 % 109,598 189 %
Directly attributable expenses (436,777) (367,102) (192,996) (69,675) 19 % (174,106) 90 %
Contribution loss $(262) $(199,426) $(134,918) $199,164 (100) % $(64,508) 48 %
(1)Net interest income and, thereby, total net revenue and contribution loss for our Financial Services segment reported for the years ended December 31, 2023 and 2022 reflect the implementation of an FTP framework, under which Financial Services segment net interest income reflects the difference between an FTP credit for the segment’s provision of deposits as a source of funding and an FTP charge for the segment’s use of funds related to credit cards. For the comparative period ended December 31, 2021, our Financial Services segment net interest income was nominal, as it did not have deposits and the credit card product was nascent. If we had applied our current FTP framework during the comparative period, the Financial Services segment net interest income would not have materially changed.
Net interest income
2023 vs. 2022. Net interest income in our Financial Services segment increased by $242.3 million, or 262%, for the year ended December 31, 2023 compared to 2022, which was primarily attributable to net interest income earned on our deposits, which includes interest income based on our FTP framework (which eliminates in consolidation) and interest expense to members. This net increase corresponds with the growth of deposits at SoFi Bank, as well as the impact of higher interest rates offered to members. In addition, net interest income earned on our credit cards increased, which includes interest income earned on outstanding balances as well as interest expense incurred under the FTP framework, and was primarily attributable to growth in total credit cards.
2022 vs. 2021. Net interest income in our Financial Services segment increased by $88.8 million for the year ended December 31, 2022 compared to 2021, which was primarily attributable to net interest income earned on our deposits, which includes interest income based on our FTP framework (which eliminates in consolidation) and interest expense to members, and corresponds with the level of deposits at SoFi Bank. In addition, net interest income earned on our credit cards increased primarily due to growth in the average balance.
Noninterest income
2023 vs. 2022. Noninterest income in our Financial Services segment increased by $26.6 million, or 35%, for the year ended December 31, 2023 compared to 2022, primarily due to an increase in interchange fees, which coincided with increased credit card and debit card transactions, as well as brokerage-related fees, which were primarily attributable to increased trading volume on our platform during 2023.
SoFi Technologies, Inc.
TABLE OF CONTENTS
2022 vs. 2021. Noninterest income in our Financial Services segment increased by $20.8 million, or 38%, for the year ended December 31, 2022 compared to 2021, primarily due to growth in referral fulfillment activity, as we continue to drive volume to our partners and an increase in interchange fees, which coincided with increased credit card and debit card transactions. The increase was partially offset by a decrease in brokerage-related fees, which was primarily attributable to decreased digital assets trading volume on our platform during 2022.
Directly attributable expenses
The directly attributable expenses allocated to the Financial Services segment that were used in the determination of the segment’s contribution loss were as follows:
Year Ended December 31, 2023 vs. 2022 2022 vs. 2021
($ in thousands) 2023 2022 2021 $ Change % Change $ Change % Change
Compensation and benefits $125,143 $110,288 $81,176 $14,855 13 % $29,112 36 %
Provision for credit losses 54,945 54,332 7,573 613 1 % 46,759 617 %
Member incentives 54,616 45,923 19,544 8,693 19 % 26,379 135 %
Product fulfillment 49,829 33,713 23,638 16,116 48 % 10,075 43 %
Direct advertising 44,347 36,660 19,051 7,687 21 % 17,609 92 %
Lead generation 36,447 30,418 10,308 6,029 20 % 20,110 195 %
Intercompany technology platform expenses 12,961 4,600 1,863 8,361 182 % 2,737 147 %
Professional services 12,719 4,590 3,832 8,129 177 % 758 20 %
Other(1) 45,770 46,578 26,011 (808) (2) % 20,567 79 %
Directly attributable expenses $436,777 $367,102 $192,996 $69,675 19 % $174,106 90 %
(1)Other expenses primarily include operational product losses, third party fraud expense, travel and occupancy-related costs, tools and subscriptions, and marketing expenses.
2023 vs. 2022. Financial Services directly attributable expenses increased by $69.7 million, or 19%, for the year ended December 31, 2023 compared to 2022, primarily due to: (i) an increase in product fulfillment costs, which included debit card fulfillment services, primarily related to our SoFi Money product, (ii) an increase in compensation and benefits expense, which reflected growth in the Financial Services segment that required additional staffing, as well as increased average compensation in 2023, (iii) an increase in direct member incentives utilized to drive adoption and usage of our Financial Services products, the most significant of which was our SoFi Money product, (iv) an increase in direct advertising costs primarily driven by an increase in online and digital advertising largely related to the promotion of our SoFi Money product, and (v) an increase related to utilization of lead generation channels, primarily related to our credit card and Relay products.
2022 vs. 2021. Financial Services directly attributable expenses increased by $174.1 million, or 90%, for the year ended December 31, 2022 compared to 2021, primarily due to: (i) an increase related to our provision for credit losses, which was primarily related to increases in the provision for credit cards due to higher average credit card balances combined with elevated credit card loss rates during 2022; (ii) an increase in compensation and benefits expense, which reflected our ongoing prioritization of growth in the Financial Services segment that required additional staffing, as well as increased average compensation in 2022; (iii) an increase in direct member incentives utilized to drive adoption and usage of our Financial Services products, the most significant of which was SoFi Checking and Savings; (iv) an increase related to utilization of lead generation channels during 2022, primarily related to SoFi Checking and Savings; and (v) an increase in direct advertising costs primarily driven by an increase in search engine and social network marketing primarily related to the continued promotion of SoFi Checking and Savings.
Corporate/Other Non-Reportable Segment
Non-segment operations are classified as Corporate/Other, which includes net revenues associated with corporate functions, non-recurring gains and losses from non-securitization investment activities and interest income and realized gains and losses associated with investments in AFS debt securities, all of which are not directly related to a reportable segment. For the years ended December 31, 2023 and 2022, net interest expense within Corporate/Other also reflects the financial impact of our capital management activities within the treasury function, which reflects the residual impact from FTP charges and FTP
SoFi Technologies, Inc.
TABLE OF CONTENTS
credits allocated to our reportable segments under our FTP framework. The following table presents the measure of total net loss for Corporate/Other:
Year Ended December 31, 2023 vs. 2022 2022 vs. 2021
($ in thousands) 2023 2022 2021 $ Change % Change $ Change % Change
Net interest expense $(35,394) $(39,958) $(9,594) $4,564 (11) % $(30,364) 316 %
Noninterest income (loss) (1,293) (9,307) 3,179 8,014 (86) % (12,486) n/m
Total net loss $(36,687) $(49,265) $(6,415) $12,578 (26) % $(42,850) 668 %
Reconciliation of Directly Attributable Expenses
The following table reconciles directly attributable expenses allocated to our reportable segments to total noninterest expense in the consolidated statements of operations and comprehensive loss:
Year Ended December 31,
($ in thousands) 2023 2022 2021
Reportable segments directly attributable expenses $(1,207,404) $(1,048,667) $(687,604)
Intercompany expenses 22,199 7,604 1,863
Expenses not allocated to segments:
Share-based compensation expense (271,216) (305,994) (239,011)
Employee-related costs(1) (250,326) (184,764) (143,847)
Depreciation and amortization expense (201,416) (151,360) (101,568)
Goodwill impairment (247,174) — —
Fair value changes in warrant liabilities — — (107,328)
Special payment(2) — — (21,181)
Other corporate and unallocated expenses(3) (268,610) (209,075) (167,373)
Total noninterest expense $(2,423,947) $(1,892,256) $(1,466,049)
(1)Includes compensation, benefits, restructuring charges, recruiting, certain occupancy-related costs and various travel costs of executive management, certain technology groups and general and administrative functions that are not directly attributable to the reportable segments.
(2)Represents a special payment to the Series 1 preferred stockholders in connection with the Business Combination in the second quarter of 2021. See Note 13. Equity to the Notes to Consolidated Financial Statements for additional information.
(3)Represents corporate overhead costs that are not allocated to reportable segments, which primarily includes corporate marketing and advertising costs, tools and subscription costs, professional services costs, corporate and FDIC insurance costs, foreign currency translation adjustments and transaction-related expenses.
Liquidity and Capital ResourcesLiquidity
We strive to maintain access to diverse funding sources and ample liquidity to fund our operating requirements, to pursue strategic growth initiatives and to meet our legal and regulatory requirements. Our principal sources of liquidity are our cash and cash equivalents, including cash from operations, and investments in other highly liquid assets.
We maintain a CALM policy that outlines specific requirements relating to the oversight of SoFi Technologies, Inc. (and its subsidiaries) capital planning, financial planning and forecasting, liquidity risk management, contingency funding planning, interest rate risk management, cash management and financial operations, among other activities. Oversight of these activities is the responsibility of our ALCO. The ALCO is comprised of a cross-functional leadership team that is responsible for managing our use of capital, liquidity, sources and uses of funding, and sensitivities to various market risks, by identifying key risks and exposures, monitoring them appropriately, establishing tolerances and limits, and mitigating risks where appropriate, to ensure the Company has the ability to meet its obligations.
SoFi Technologies, Inc.
TABLE OF CONTENTS
The following table summarizes our total liquidity reserves:
                                                                                                                                          December 31, 2023
                                              Amount Available               Amount Borrowed / Utilized                        Remaining Available Capacity
Cash and cash equivalents $3,085,020 n/a $3,085,020
Investments in AFS debt securities(1) 463,448 n/a 463,448
Warehouse facilities(2) 9,170,000 3,239,528 5,930,472
Revolving credit facility(3) 645,000 499,100 145,900
FHLB advances(4) 166,525 27,200 139,325
Other lines of credit(5) 50,000 — 50,000
Total liquidity $13,579,993 $3,765,828 $9,814,165
(1)Excludes investments in AFS debt securities which are pledged as collateral to the FHLB.
(2)Includes personal loan, student loan, credit card and risk retention warehouse facilities. For risk retention facilities, we only include capacity amounts wherein we can pledge additional asset-backed bonds and residual investments as of the date indicated. As of December 31, 2023, warehouse facility maturity dates ranged from January 2024 through January 2032. See Note 9. Debt to the Notes to Consolidated Financial Statements for additional information.
(3)As of December 31, 2023, the amount utilized under the revolving credit facility includes $13.1 million utilized to secure letters of credit. See Note 9. Debt to the Notes to Consolidated Financial Statements for additional information.
(4)As of December 31, 2023, we had $131.7 million of investments in AFS debt securities and $54.8 million of loans pledged as collateral to the FHLB to secure undrawn borrowing capacity of $166.5 million, of which $27.2 million was utilized to secure letters of credit.
(5)Borrowing capacity with correspondent banks is unsecured.
We believe our existing liquidity will be sufficient to cover net losses, meet our existing working capital and capital expenditure needs, as well as our planned growth for at least the next 12 months.
Sources of Funding
Our primary funding sources include SoFi Bank deposits, warehouse funding, common and preferred equity capital, convertible debt, corporate revolving credit facility, securitizations, and other financings.
We offer deposit accounts (checking and savings accounts) to our members through SoFi Bank. We also source brokered and non-brokered wholesale deposits, which include certificates of deposit. As of December 31, 2023 and December 31, 2022, time deposit balances due in less than one year totaled $2.6 billion and $1.0 billion, respectively. As of December 31, 2023 and December 31, 2022, the amount of uninsured deposits totaled $348.1 million and $615.9 million, respectively. In 2023, we began to provide our members with access to expanded FDIC insurance coverage through a network of participating banks in our Insured Deposit Program, which contributed to the decrease in uninsured deposits relative to year end. As of December 31, 2023, approximately 98% of our total deposits were insured.
The following table presents uninsured time deposits as of December 31, 2023 by remaining time to maturity:
($ in thousands) December 31, 2023
3 months or less $4,843
Over 3 months through 6 months 4,286
Over 6 months through 12 months 11,939
Over 12 months 200
Total uninsured time deposits $21,268
Uses of Funding
Our primary uses of funds include loan originations, investments in our business, such as technology and product investments and sales and marketing initiatives, as well as the losses generated by our Financial Services segment on a year-to-date basis. Our capital expenditures have historically been less significant relative to our operating and financing cash flows, and we expect this trend to continue for the foreseeable future.
As of December 31, 2023, we had debt obligations, common stock and redeemable preferred stock outstanding.
SoFi Technologies, Inc.
TABLE OF CONTENTS
Borrowings
Our borrowings primarily included our loan and risk retention warehouse facilities, asset-backed securitization debt, revolving credit facility and convertible notes. The amount of financing actually advanced on each individual loan under our loan warehouse facilities, as determined by agreed-upon advance rates, may be less than the stated advance rate depending, in part, on changes in underlying loan characteristics of the loans securing the financings. Each of our loan warehouse facilities allows the lender providing the funds to evaluate the market value of the loans that are serving as collateral for the borrowings or advances being made. The amount owed and outstanding on our loan warehouse facilities fluctuates significantly based on our origination volume, sales volume, the amount of time we strategically hold loans on our balance sheet, and the amount of loans being funded with our cash or member deposits.
In October 2021, we closed on the issuance of $1.2 billion aggregate principal amount of convertible senior notes (the “convertible notes”), which do not bear regular interest, will mature in October 2026 (unless earlier repurchased, redeemed or converted) and will be convertible by the noteholders beginning in April 2026 under certain circumstances. In December 2023, the Company entered into agreements to repurchase $88.0 million aggregate principal amount of the convertible notes, for which the Company issued 9,490,000 shares of common stock to settle. Following these repurchases, $1.1 billion aggregate principal amount of the convertible notes remain outstanding. Redemption events and conversion events (to the extent we elect to cash settle) could require a material use of cash at the time of the event. See Note 12. Debt to the Notes to Consolidated Financial Statements for additional information on the conversion, settlement and redemption terms of the convertible notes. Additionally, if special interest or additional interest is incurred on the convertible notes, it could require an additional use of cash.
In connection with the issuance of the convertible notes, we entered into privately negotiated Capped Call Transactions with certain financial institutions, which are expected to generally reduce the potential dilutive effect on the common stock upon any conversion of the notes and/or offset any cash payments we are required to make in excess of the principal amount of the converted notes, as the case may be. Refer to Note 13. Equity for additional information on the Capped Call Transactions. All of these transactions are expected to remain in effect notwithstanding the December 2023 repurchases.
The net proceeds from the October 2021 convertible debt issuance were $1.2 billion. We used $113.8 million of the net proceeds to fund the cost of entering into the Capped Call Transactions. We allotted the remainder of the net proceeds to pay related expenses and for general corporate purposes.
Covenants
We have various affirmative and negative financial covenants, as well as non-financial covenants, related to our warehouse debt and revolving credit facility, as well as our Series 1 Redeemable Preferred Stock. Additionally, we have compliance requirements associated with our convertible notes, and certain provisions of the arrangement could change in the event of a “Make-Whole Fundamental Change”, as defined in the indenture governing such convertible notes.
The availability of funds under our warehouse facilities and revolving credit facility is subject to, among other conditions, our continued compliance with the covenants. These financial covenants include, but are not limited to, maintaining: (i) a certain minimum tangible net worth, (ii) minimum unrestricted cash and cash equivalents, (iii) a maximum leverage ratio of total debt to tangible net worth, and (iv) minimum risk-based capital and leverage ratios. A breach of these covenants can result in an event of default under these facilities and allows the lenders to pursue certain remedies. See Note 12. Debt to the Notes to Consolidated Financial Statements for additional information. Our subsidiaries are restricted in the amount that can be distributed to SoFi only to the extent that such distributions would cause the financial covenants to not be met.
In addition, pursuant to our amended and restated agreement related to our Series 1 Redeemable Preferred Stock, we are subject to the following financial covenants:
•Tangible net worth to total debt ratio requirement, which excludes our warehouse, risk retention and securitization related debt;
•Tangible net worth to Series 1 Redeemable Preferred Stock ratio requirement; and
•Minimum excess equity requirements, where the measure of equity includes permanent equity and SoFi Technologies Redeemable Preferred Stock (exclusive of Series 1 Redeemable Preferred Stock), as applicable.
We were in compliance with all covenants as of December 31, 2023.
SoFi Technologies, Inc.
TABLE OF CONTENTS
Capital Management
SoFi Technologies, a bank holding company, and SoFi Bank, a nationally chartered association, are required to comply with regulatory capital rules issued by the Federal Reserve and other U.S. banking regulators, including the OCC and FDIC. From time to time, we may contribute capital to SoFi Bank. We are required to manage our capital position to maintain sufficient capital to satisfy these regulatory rules and support our business activities, including the requirement to maintain minimum regulatory capital ratios in accordance with the Basel Committee on Banking Supervision standardized approach for U.S. banking organizations (U.S. Basel III). If the Federal Reserve finds that we are not “well-capitalized” or “well-managed”, we would be required to take remedial action, which may contain additional limitations or conditions relating to our activities.
These requirements establish required minimum ratios for CET1 risk-based capital, Tier 1 risk-based capital, total risk-based capital and a Tier 1 leverage ratio; set risk-weighting for assets and certain other items for purposes of the risk-based capital ratios; and define what qualifies as capital for purposes of meeting the capital requirements.
As of December 31, 2023, our regulatory capital ratios exceeded the thresholds required to be regarded as a well-capitalized institution, and meet all capital adequacy requirements to which we are subject. There have been no events or conditions since December 31, 2023 that management believes would change the categorization. See Note 21. Regulatory Capital to the Notes to Consolidated Financial Statements for the risk- and leverage-based capital ratios and amounts for SoFi Bank and SoFi Technologies.
Cash Requirements from Known Contractual Obligations and Other Commitments
The following table summarizes our cash requirements from known contractual obligations and other commitments as of December 31, 2023:
Payments Due by Period
($ in thousands) Total Less than 1 Year 1 – 3 Years 3 – 5 Years More than 5 Years
Warehouse debt(1) $3,249,375 $638,473 $2,581,173 $29,729 $—
Revolving credit facility(2) 632,501 — — 632,501 —
Convertible notes(3) 1,111,972 — 1,111,972 — —
Operating lease obligations 133,479 24,536 44,663 30,984 33,296
Sponsorship, advertising, and cloud computing agreements(4) 670,329 85,807 104,610 90,082 389,830
Total contractual obligations(5) $5,797,656 $748,816 $3,842,418 $783,296 $423,126
(1)The amounts reported exclude future interest expense, other than interest accrued as of December 31, 2023, as it is difficult to predict the amount of interest we will incur due to the variability of the utilization of our warehouse debt and timing of collateral cash flows. As such, only principal commitments and the aforementioned accrued interest are included herein. See Note 12. Debt to the Notes to Consolidated Financial Statements for additional information on our warehouse debt.
(2)Includes principal balance and variable interest on our revolving credit facility. The estimated interest payments assume that our borrowings under the revolving credit facility (i) remain unchanged, (ii) are held to maturity, and (iii) incur interest at the rate for standard withdrawals in effect as of December 31, 2023 through its maturity. See Note 12. Debt to the Notes to Consolidated Financial Statements for additional information on our revolving credit facility.
(3)The convertible notes will mature on October 15, 2026, unless earlier repurchased, redeemed or converted. See “Borrowings” for additional information on these provisions.
(4)See Note 18. Commitments, Guarantees, Concentrations and Contingencies to the Notes to Consolidated Financial Statements for additional information on these financial commitments.
(5)Contractual obligations exclude residual interests classified as debt that result from transfers of assets that are accounted for as secured financings. Similarly, contractual obligations exclude securitization debt, as the maturity of the notes issued by the various trusts occurs upon either the maturity of the loan collateral or full payment of the loan collateral held in the trusts, the timing of which cannot be reasonably estimated. Additionally, our own liquidity resources are not required to make any contractual payments on these borrowings, except in limited instances associated with our guarantee arrangements. Our maturity date represents the legal maturity of the last class of maturing notes. See Note 18. Commitments, Guarantees, Concentrations and Contingencies to the Notes to Consolidated Financial Statements for further discussion of our guarantees. Finally, contractual obligations exclude the impact of uncertain tax positions, as we are not able to reasonably estimate the timing of such future cash flows. See Note 17. Income Taxes to the Notes to Consolidated Financial Statements for additional information on income taxes and unrecognized tax benefits.
Guarantees
We may require liquidity resources associated with our guarantee arrangements. As a component of our loan sale agreements, we make certain representations to third parties that purchased our previously held loans. We have a three-year obligation to GSEs on loans that we sell to GSEs, to repurchase any originated loans that do not meet certain GSE guidelines,
SoFi Technologies, Inc.
TABLE OF CONTENTS
and we are required to pay the full initial purchase price back to the GSEs. In addition, we make standard representations and warranties related to personal, student and home loan transfers, as well as limited credit-related repurchase guarantees on certain such transfers. If realized, any of the repurchases would require the use of cash. See Note 18. Commitments, Guarantees, Concentrations and Contingencies to the Notes to Consolidated Financial Statements for further information on these and other guarantee obligations. We believe we have adequate liquidity to meet these expected obligations.
Factors Affecting Liquidity
We are currently dependent on the success of our lending business. The primary drivers of operating cash flows related to our Lending segment are origination volume, the holding period of our loans, loan sale execution and the timing of loan repayments. Our ability to access whole loan buyers, to sell our loans on favorable terms, to maintain adequate warehouse capacity at favorable terms, to access new deposits and grow existing deposits and to strategically manage our continuing financial interest in securitization-related transfers is critical to our growth strategy and our ability to have adequate liquidity to fund our balance sheet. Our ability to attract and maintain deposits can be impacted by, among other things, general economic conditions, the condition of the banking sector (such as bank failures or exposure to credit, market, operational, legal and reputational risks), competition from other financial services firms, idiosyncratic events and the interest rates we offer, which can impact our liquidity from deposits. Through 2023, we continued to have strong deposit contribution. During 2023, we also provided our members with access to expanded FDIC insurance coverage through a network of participating banks in our Insured Deposit Program.
There is no guarantee that we will be able to execute on our strategy as it relates to the timing and pricing of securitization-related transfers. Therefore, we may hold securitization interests for longer than planned or be forced to liquidate at suboptimal prices. Securitization transfers are also negatively impacted during recessionary periods, wherein purchasers may be more risk averse.
Further, future uncertainties around the demand for our personal loans, home loans and around the student loan refinance market in general, including as a result of worsening macroeconomic conditions or continued turmoil in the banking and financial services sectors, should be considered when assessing our future liquidity and solvency prospects. In the future, our loan origination volume and our resulting loan balances, and any positive cash flows thereof, could also be lower based on strategic decisions to tighten our credit standards.
In addition to our ability to pledge unencumbered loans against available warehouse capacity, we have relationships with whole loan buyers who have historically demonstrated strong demand for our loans. Securitization markets can also generate additional liquidity; however, financing through the securitization market could result in worse execution as compared to whole loans sales depending on market conditions and, in certain cases, we are required to maintain a minimum investment due to securitization risk retention rules.
Additionally, our securitization transactions require us to maintain a continuing financial interest in the form of securitization investments when we deconsolidate the SPE or in consolidation of the SPE when we have a significant financial interest. In either instance, the continuing financial interest requires us to maintain capital in the SPE that would otherwise be available to us if we had sold loans through a different channel. As it relates to our securitization debt, the maturity of the notes issued by the various trusts occurs upon either the maturity of the loan collateral or full payment of the loan collateral held in the trusts, the timing of which cannot be reasonably estimated. Our own liquidity resources are not required to make any contractual payments on our securitization borrowings.
Our cash flows from operations have also historically been impacted by material net losses. While we achieved net income profitability for the first time during the fourth quarter of 2023, changing business, macroeconomic or other conditions could potentially lead us, in the future, to raise additional capital in the form of equity or debt, which may not be at favorable terms when compared to previous financing transactions.
Our long-term liquidity strategy includes continuing to grow our deposit base, maintaining adequate warehouse capacity, maintaining corporate debt and other sources of financing, as well as effectively managing the capital raised through debt and equity transactions. Although our goal is to increase our cash flow from operations, there can be no assurance that our future operating plans will lead to improved operating cash flows.
The FDIA and FDIC regulations generally limit the ability of an insured depository institution to accept, renew or roll over any brokered deposit unless the institution’s capital category is “well capitalized” or, with the FDIC’s approval, “adequately capitalized.” See Part I, Item 1. “Government Supervision and Regulation—Brokered Deposits” for additional information. As of December 31, 2023, our regulatory capital ratios exceeded the thresholds required to be regarded as a well-capitalized institution, and meet all capital adequacy requirements to which we are subject.
SoFi Technologies, Inc.
TABLE OF CONTENTS
Cash Flow and Liquidity Analysis
The following table provides a summary of cash flow data:
Year Ended December 31,
($ in thousands) 2023 2022 2021
Net cash used in operating activities $(7,227,139) $(7,255,858) $(1,350,217)
Net cash (used in) provided by investing activities (1,889,864) (106,333) 110,193
Net cash provided by financing activities 10,885,602 8,439,485 684,987
Cash Flows from Operating Activities
For the year ended December 31, 2023, net cash used in operating activities of $7.2 billion stemmed from a net loss of $300.7 million and an unfavorable change in our operating assets net of operating liabilities of $7.6 billion, partially offset by a positive adjustment for non-cash items of $706.8 million. The change in operating assets net of operating liabilities was primarily a result of our loan origination and sales activities. We originated loans of $17.4 billion during the year and also purchased loans of $198.7 million. These cash uses were partially offset by principal payments on loans of $7.2 billion and proceeds from loan sales of $2.1 billion.
For the year ended December 31, 2022, net cash used in operating activities of $7.3 billion stemmed from a net loss of $320.4 million and an unfavorable change in our operating assets net of operating liabilities of $7.5 billion, partially offset by a positive adjustment for non-cash items of $560.1 million. The change in operating assets net of operating liabilities was primarily a result of our loan origination and sales activities. We originated loans of $13.0 billion during the year and also purchased loans of $2.5 billion. These cash uses were largely offset by principal payments on loans of $3.1 billion and proceeds from loan sales of $4.9 billion.
For the year ended December 31, 2021, net cash used in operating activities of $1.4 billion stemmed from a net loss of $483.9 million and an unfavorable change in our operating assets net of operating liabilities of $1.3 billion, partially offset by a positive adjustment for non-cash items of $479.0 million. The change in operating assets net of operating liabilities was primarily a result of our loan origination and sales activities. We originated loans of $13.0 billion during the year and also purchased loans of $451.0 million. These cash uses were offset by principal payments on loans of $2.2 billion and proceeds from loan sales of $10.0 billion.
Cash Flows from Investing Activities
For the year ended December 31, 2023, net cash used in investing activities of $1.9 billion was primarily attributable to $1.4 billion related to loan activities, primarily driven by student loans, senior secured loans and credit cards, net purchases of $381.0 million related to our investments in AFS debt securities, $111.4 million for purchases of property, equipment and software, which primarily included internally-developed software and purchased software, $72.3 million related to business combinations, net of cash acquired, which includes our acquisition of Wyndham and settlements of vested employee performance awards associated with the Technisys Merger, and $66.6 million related to purchases of non-securitization investments, primarily FRB stock and FHLB stock. These uses were partially offset by proceeds of $108.3 million from our securitization investments.
For the year ended December 31, 2022, net cash used in investing activities of $106.3 million was primarily attributable to proceeds of $118.8 million from our securitization investments and the aggregate net cash acquired from the Technisys Merger and Bank Merger of $58.5 million. These sources were more than offset by net cash uses of $173.7 million related to loan activities, primarily driven by credit cards, $93.2 million for purchases of property, equipment and software, which primarily included internally-developed software and purchased software, as well as $10.5 million related to costs incurred in the development and enhancement of software to be sold, leased or marketed.
For the year ended December 31, 2021, net cash provided by investing activities of $110.2 million was primarily attributable to proceeds of $107.5 million from the call on our Apex equity method investment and $16.7 million from repayment of the outstanding principal balance on its related party notes, as well as proceeds of $247.1 million from our securitization investments. These cash proceeds were partially offset by $246.4 million of investments made in AFS debt securities, reduced by proceeds of $57.5 million from sales and maturities of these investments. Additionally, we made an equity method investment of $20.0 million during the third quarter of 2021. Lastly, we used cash of $52.3 million for purchases of property, equipment and software, which primarily included internally-developed software, purchased software, and furniture and fixtures.
SoFi Technologies, Inc.
TABLE OF CONTENTS
Cash Flows from Financing Activities
For the year ended December 31, 2023, net cash provided by financing activities of $10.9 billion was primarily attributable to net cash sources from our SoFi Bank deposits of $11.2 billion. This was partially offset by debt repayments of $799.9 million which exceeded our proceeds from debt financing activity of $520.5 million, which were primarily related to our warehouse facilities. Our payments of debt issuance costs were in the normal course of business and reflective of our recurring debt warehouse facility activity, which involves securing new warehouse facilities and extending existing warehouse facilities.
For the year ended December 31, 2022, net cash provided by financing activities of $8.4 billion was primarily attributable to net cash sources from our SoFi Bank deposits of $7.2 billion. Additionally, our proceeds from debt financing activities of $1.9 billion exceeded our debt repayments of $516.4 million, which were primarily related to our warehouse facilities. Our payments of debt issuance costs were in the normal course of business and reflective of our recurring debt warehouse facility activity, which involves securing new warehouse facilities and extending existing warehouse facilities. Finally, we paid redeemable preferred stock dividends of $40.4 million and taxes related to RSU vesting of $9.0 million.
For the year ended December 31, 2021, net cash provided by financing activities was $685.0 million. We received proceeds from the Business Combination and PIPE Investment of $2.0 billion, and paid costs directly related to the Business Combination and PIPE Investment of $27.0 million. We received $1.2 billion of proceeds from debt financing activities related to our lending activities and issuance of our convertible notes. These debt proceeds were more than offset by $0.9 billion of debt repayments, of which $9.5 billion were related to our warehouse facilities and $250 million were related to repayment of the seller note. We also had capped call purchases of $113.8 million in connection with the issuance of our convertible notes. Our payments of debt issuance costs were in the normal course of business and reflective of our recurring debt warehouse facility activity. We also received proceeds from warrant exercises of $95.0 million. We paid taxes related to RSU vesting of $42.6 million, as well as redeemable preferred stock dividends of $40.4 million. We also received $25.2 million of proceeds from common stock option exercises. Finally, we paid $282.9 million to repurchase redeemable common and preferred stock.
Other Arrangements
We enter into arrangements in which we originate loans, establish an SPE and transfer loans to the SPE, which has historically served as an important source of liquidity. We also retain the servicing rights of the underlying loans and hold additional interests in the SPE. When an SPE is determined not to be a VIE or when an SPE is determined to be a VIE but we are not the primary beneficiary, the SPE is not consolidated. In addition, a significant change to the pertinent rights of other parties or our pertinent rights, or a significant change to the ranges of possible financial performance outcomes used in our assessment of the variability of cash flows due to us, could impact the determination of whether or not a VIE is consolidated. VIE consolidation and deconsolidation may lead to increased volatility in our financial results and impact period-over-period comparability. See Note 1. Organization, Summary of Significant Accounting Policies and New Accounting Standards to the Notes to Consolidated Financial Statements for our VIE consolidation policy.
Historically, we have established personal loan trusts and student loan trusts that were created and designed to transfer credit and interest rate risk associated with the underlying loans through the issuance of collateralized notes and residual certificates. We hold a variable interest in the trusts through our ownership of collateralized notes in the form of asset-backed bonds and residual certificates. The residual certificates absorb variability and represent the equity ownership interest in the equity portion of the personal loan and student loan trusts.
We are also the servicer for all trusts in which we hold a financial interest. Although we have the power as servicer to perform the activities that most impact the economic performance of the VIE, we do not hold a significant financial interest in the trusts and, therefore, we are not the primary beneficiary. Further, we do not provide financial support beyond our initial equity investment, and our maximum exposure to loss as a result of our involvement with nonconsolidated VIEs is limited to our investment. For a more detailed discussion of nonconsolidated VIEs, including related activity during the year, see Note 7. Securitization and Variable Interest Entities to the Notes to Consolidated Financial Statements.
Financial Condition Summary
Changes in the composition and balance of our assets and liabilities as of December 31, 2023 compared to December 31, 2022 were principally attributed to the following:
•an increase of $1.8 billion in cash and cash equivalents and restricted cash and restricted cash equivalents. See “Cash Flow and Liquidity Analysis” for further discussion of our cash flow activity;
•an increase in loans of $9.1 billion, which was primarily related to increased personal and student loan originations and longer loan holding periods;
SoFi Technologies, Inc.
TABLE OF CONTENTS
•an increase in deposits of $11.3 billion, which was primarily related to increased savings deposits from members and increased broker deposits; and
•an increase of $180.6 million in gross warehouse and risk retention facility debt to support our originations during the current period, which reflected the net impact of $12.3 billion of cash borrowings and $12.1 billion of cash repayments.
Critical Accounting Policies and EstimatesOur consolidated financial statements have been prepared in accordance with GAAP. In preparing our consolidated financial statements, we make judgments, estimates and assumptions that affect reported amounts of assets and liabilities, as well as revenues and expenses. We base our assumptions, judgments and estimates on historical experience and various other factors that we believe to be reasonable under the circumstances. The results involve judgments about the carrying values of assets and liabilities not readily apparent from other sources. Actual results could differ materially from these estimates under different assumptions or conditions. We regularly evaluate our estimates, assumptions and judgments, particularly those that include the most difficult, subjective or complex judgments and are often about matters that are inherently uncertain. See Note 1. Organization, Summary of Significant Accounting Policies and New Accounting Standards to the Notes to Consolidated Financial Statements for a summary of our significant accounting policies. The most significant judgments, estimates and assumptions relate to the critical accounting policies, which are discussed in detail below. We evaluate our critical accounting policies and estimates on an ongoing basis and update them as necessary based on changes in market conditions or factors specific to us.
Fair Value
Fair value is defined as the price that would be received for an asset or paid to transfer a liability (an exit price) in the principal or most advantageous market for the asset or liability in an orderly transaction between market participants on the measurement date. We use a three-level fair value hierarchy to classify and disclose all assets and liabilities measured at fair value on a recurring basis in periods subsequent to their initial measurement. The hierarchy requires us to use observable inputs when available and to minimize the use of unobservable inputs when determining fair value. The three levels are defined as follows:
•Level 1 — Quoted prices in active markets for identical assets or liabilities, accessible by us at the measurement date.
•Level 2 — Quoted prices for similar assets or liabilities in active markets, or quoted prices for identical or similar assets or liabilities in markets that are not active, or observable inputs other than quoted prices.
•Level 3 — Unobservable inputs for assets or liabilities for which there is little or no market data, which requires us to develop our own assumptions. These unobservable assumptions reflect estimates of inputs that market participants would use in pricing the asset or liability. Valuation techniques include the use of option pricing models, discounted cash flow models, or similar techniques, which incorporate management’s own estimates of assumptions that market participants would use in pricing the asset or liability.
A financial instrument’s categorization within the fair value hierarchy is based on the lowest level of input that is significant to the fair value measurement. Instruments are categorized in Level 3 of the fair value hierarchy based on the significance of unobservable factors in the overall fair value measurement. Our involvement with VIEs and origination of personal loans, student loans and home loans results in Level 2 and Level 3 assumptions having a material impact on our consolidated financial statements, as further discussed below. We utilize third-party valuation specialists to perform a valuation of these Level 2 and Level 3 financial instruments on a monthly basis with quarterly oversight by a Valuation Working Group established by the Company that comprises leaders across finance, capital markets and accounting.
Loans
We elected the fair value option to measure our personal loans and student loans, as we believe that fair value best reflects the expected economic performance of the loans. These loans do not trade in an active market with readily observable prices, and are classified as Level 3 because the valuations utilize significant unobservable inputs.
We determine the fair value of our loans using a DCF calculation, which is a form of the income approach, while also considering market data as it becomes available. In applying the DCF methodology, we estimate the future cash flows of each loan portfolio using key loan metrics, such as term, vintage, coupon rate, coupon type and current balance, among others. The significant assumptions used in the valuation model include conditional prepayment rate, annual default rate and discount rate. The conditional prepayment rate represents the monthly annualized proportion of the principal of a pool of loans that is assumed to be paid off prematurely in each period. The annual default rate represents the annualized rate of borrowers who do
SoFi Technologies, Inc.
TABLE OF CONTENTS
not make loan payments on time. The conditional prepayment and annual default rate assumptions are determined using company-specific historical loan performance curves. The discount rate represents the weighted average rate at which the expected cash flows are discounted to arrive at the net present value of the loans. The discount rate is determined based on company-specific factors and market observations, including underlying benchmark rates, our weighted average coupon rate and expected duration of the assets, the last of which is also impacted by expected prepayment rates. We also consider the volume and terms of recent whole loan sales and securitization market pricing factors, as applicable, as indicators of loan fair values.
Securitizations
Loans in consolidated VIEs remain on our consolidated balance sheet and are measured at fair value using Level 3 inputs in a manner consistent with our non-securitization loans. Moreover, third-party residual claims on these loans are measured at fair value on a recurring basis and are presented as residual interests classified as debt in our consolidated balance sheet. We classify the residual interests classified as debt as Level 3 due to the reliance on significant unobservable valuation inputs. In Company-sponsored securitization transactions that meet the applicable criteria to be accounted for as a sale, we retain certain asset-backed bonds, which are measured at fair value on a recurring basis using Level 2 inputs, and residual investments, which are measured at fair value on a recurring basis using Level 3 inputs. These risk retention interests in nonconsolidated VIEs are referred to as securitization investments.
We determine the fair value of our residual interests classified as debt and our securitization investments using a DCF calculation, while also considering market data as it becomes available. In applying the DCF methodology, we estimate the future collateral cash flows using key securitization portfolio metrics, such as contractual payments and delinquency profile, among others. The significant assumptions used in the valuation model include conditional prepayment rate, annual default rate and discount rate. The conditional prepayment and annual default rate assumptions are determined using observed prepayment and default performance. The discount rate is determined based on market observations, such as secondary trading information, newly closed deals, benchmark rates and spread index, among others.
See “Quantitative and Qualitative Disclosures About Market Risk” for discussion of the sensitivity of our financial instruments measured at fair value to changes in various market risks.
Business Combinations
We account for acquisitions of entities or asset groups that qualify as businesses using the acquisition method of accounting. Purchase consideration is allocated to the tangible and intangible assets acquired and liabilities assumed based on the estimated fair values as of the acquisition date, and which are typically determined in consultation with an independent appraiser. The determination of fair value requires management to make estimates about discount rates, future expected cash flows, market conditions and other future events that are highly subjective in nature. The judgments made in the determination of the estimated fair value assigned to the assets acquired and liabilities assumed, as well as the estimated useful life of each asset and the duration of each liability, could significantly impact the consolidated financial statements in periods after the acquisition, such as through depreciation and amortization expense.
Management uses significant judgment to determine the fair value of intangible assets. For developed technology, management applies the Multi-Period Excess Earnings Method, which is a form of the income approach, for which the significant assumptions generally include expected earnings attributable to the asset (including an assumed technology migration curve), contributory asset charges and an assumed discount rate. For customer-related intangibles, management applies the With and Without Method, which is a form of the income approach, for which the significant assumptions generally include estimated annual revenues and net cash flows (including revenue ramp-up periods and customer attrition rates), and an assumed discount rate. For trade names, trademark and domain names, management applies the Relief from Royalty Method, which is a form of the income approach, for which the significant assumptions generally include expected earnings attributable to the asset, the probability of use of the asset, the royalty rate and an assumed discount rate. The assumed discount rates across the valuation methods reflect the risk of the asset relative to the overall risk of the acquired business. Definite-lived intangible assets are straight-line amortized over their useful lives and reviewed for impairment annually and whenever events or circumstances indicate that the carrying amount of such assets may not be recoverable. During the year ended December 31, 2023, we did not recognize any impairment of definite-lived intangible assets.
The excess of the total purchase consideration over the fair value of the identified net assets acquired is recognized as goodwill. Acquisition-related costs are expensed as incurred. The results of operations for each acquisition are included in our consolidated financial results beginning on the respective acquisition date.
SoFi Technologies, Inc.
TABLE OF CONTENTS
During the measurement period, which may be up to one year from the acquisition date, we may record adjustments to the allocation of purchase consideration and to the fair values of assets acquired and liabilities assumed to the extent that additional information becomes available. After this period, any subsequent adjustments are recorded in the consolidated statements of operations and comprehensive loss.
Goodwill
Goodwill represents the fair value of an acquired business in excess of the fair value of the identified net assets acquired. As of December 31, 2023, we had goodwill of $1.4 billion, of which $17.7 million was recognized during the year in connection with business combinations.
Goodwill is tested for impairment at the reporting unit level at least annually, with a recurring testing date of October 1, or whenever indicators of impairment exist. Impairment of goodwill is the condition that exists when the carrying amount of a reporting unit that includes goodwill exceeds its fair value. We may assess goodwill for impairment initially based on qualitative considerations, referred to as “step zero”, to determine whether conditions exist that indicate that it is more likely than not that the fair value of a reporting unit is less than its carrying amount. If management concludes, based on its assessment of relevant events, facts and circumstances that it is more likely than not that a reporting unit’s carrying value is greater than its fair value, then a quantitative analysis, referred to as step one, will be performed to determine if there is any impairment. We may alternatively elect to initially perform a quantitative assessment and bypass the qualitative assessment. Quantitative goodwill impairment assessments require a significant amount of management judgment, and a meaningful change in the forecasted future revenues and cash flows, the discount rate, and the determination of market multiples used in testing goodwill for impairment could result in a material impact on the Company’s results of operations and financial position.
A goodwill impairment loss is recognized for the amount that the carrying amount of a reporting unit, including goodwill, exceeds its fair value, limited to the total amount of goodwill allocated to that reporting unit. Therefore, if the fair value of a reporting unit exceeds its carrying amount, goodwill of the reporting unit is not impaired. Our reporting units for our goodwill impairment analysis represent components of our business at one level below our operating segments.
An interim test is performed when events or circumstances occur that may indicate that it is more likely than not that the fair value of any reporting unit may be less than its carrying value. During the third quarter of 2023, the Technology Platform segment continued to experience slower growth rates than expected at the time of acquisition due to: (i) the uncertain macroeconomic environment, which has continued to impact customer spend volume, and (ii) continued longer sales cycles as a result of our shift in strategy to focus on diversified durable growth driven by potential new partners with scaled customer bases and interest in multiple Technology Platform products. These factors constituted a triggering event for goodwill testing purposes. As a result, we performed an interim quantitative test on the Galileo and Technisys reporting units to determine the existence and magnitude of potential goodwill impairment. We determined it was not necessary to perform an interim goodwill impairment test for our other reporting units.
During the third quarter of 2023, management calculated the fair value amount of the Galileo and Technisys reporting units using a combination of a DCF calculation, which is a form of the income approach, and a market multiples calculation, which is a form of the market approach. The discount rates used for the Galileo and Technisys reporting units in our interim quantitative assessment were 14.0% and 23.5%, respectively. The higher discount rate at Technisys was primarily driven by macroeconomic factors in Latin America, specifically the highly inflationary economic environment in Argentina. Additionally, management applied a terminal year long-term growth rate of 3.5% to both reporting units, consistent with previous quantitative assessments. As a result of this assessment, the fair value of the Galileo and Technisys reporting units were determined to be below their carrying values by 9.9% and 14.8%, respectively, resulting in management recognizing non-cash goodwill impairment charges of $124.5 million and $122.7 million for the Galileo and Technisys reporting units, respectively. If the discount rate applied to the estimated cash flows was increased or decreased by 50 basis points, the fair value of the Galileo and Technisys reporting units would decrease or increase by 6% and 4%, respectively. Similarly, if the long-term growth rate was increased or decreased by 50 basis points, the fair value of the Galileo and Technisys reporting units would increase or decrease by approximately 3% and 1%, respectively.
In performing the qualitative assessments of each reporting unit as of October 1, 2023, the Company evaluated events and circumstances since the last quantitative goodwill assessments to determine if it was not more likely than not that our goodwill was not impaired as of our annual impairment testing date. The factors evaluated included an assessment of macroeconomic conditions, industry and market conditions, key financial metrics, overall financial performance of the reporting unit, or any other specific events or changes. After assessing the relevant events and circumstances, we concluded it is not more-likely-than-not that the fair value of the reporting unit is below its carrying value as of our annual impairment assessment date.
SoFi Technologies, Inc.
TABLE OF CONTENTS
We monitored events and circumstances during the fourth quarter of 2023, concluding that it was not more-likely-than-not that the fair value of a reporting unit is below its respective carrying value as of December 31, 2023.
Management cannot predict the occurrence of certain events or changes in circumstances that might adversely affect the value of goodwill. We continue to monitor the aforementioned conditions, general macroeconomic deterioration, including the interest rate environment, inflationary pressures, and the potential for a prolonged economic downturn or recession, as well as other factors, including those listed in "Cautionary Statement Regarding Forward-Looking Statements" and "Risk Factors" in Part I, Item 1A of this Annual Report. Further persistence of the aforementioned conditions and these other factors could result in additional impairment charges in future periods.
See Note 8. Goodwill and Intangible Assets to the Notes to Consolidated Financial Statements for additional disclosures related to goodwill.
Recent Accounting Standards Issued, But Not Yet Adopted
See Note 1. Organization, Summary of Significant Accounting Policies and New Accounting Standards to the Notes to Consolidated Financial Statements.